
Figures & data
Figure 1. Overview of the Multigranular Artificial Intelligence (AI) approach. Participant data were analyzed using two complementary AI approaches: Unsupervised Learning and Supervised Learning. The unsupervised learning tasks were designed for categories of clinical interest (i.e. diagnostic categories, suicide attempt). The supervised learning technique included five stages: feature engineering, class balancing by synthetic oversampling, k-fold cross-validation, model training, and testing. Model training included feature ranking and selection, and statistical testing of the top features. Of note, variables are called features in machine learning.
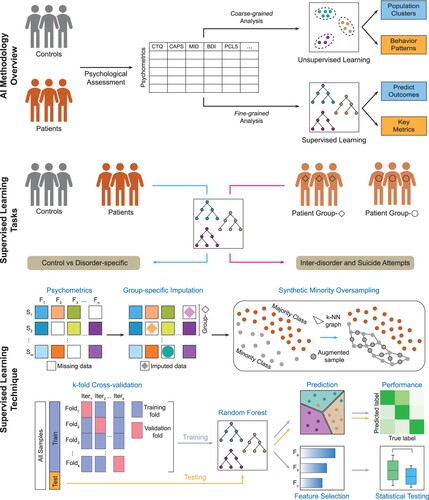
Table 1. Summary of demographics and clinical data.
Figure 2. Unsupervised learning reveals patient sub-clusters and spectrum of dissociative symptoms. (A) Two-dimensional t-SNE embedding of summary psychometrics on arbitrary X and Y axes, annotated with diagnosis labels, shows patient heterogeneity patterns with a distinct ‘DID cluster’ of 26 individuals (circled). (B and C) Embedding annotated with CTQ and BDI-II severity respectively, shows the ‘DID cluster’ has a high rate of extreme trauma and severe depression. (D) Annotation of individuals who attempted suicide where we found past suicide attempt was more prevalent in the ‘DID cluster.’ (E) DAWN 2D embedding of only the patients on arbitrary X and Y axes demonstrated the presence of a spectrum of dissociative symptoms with clustering of individuals who attempted suicide. (F) Bubble plot showing the relationship between childhood trauma and depression severity and prevalence of individuals who attempted suicide. t-SNE, t-Distributed stochastic neighbour embedding; CTQ, Childhood Trauma Questionnaire, BDI-II, Beck Depression Inventory-II, DAWN 2D, Denoising Autoencoder with Neuronal Approximator.
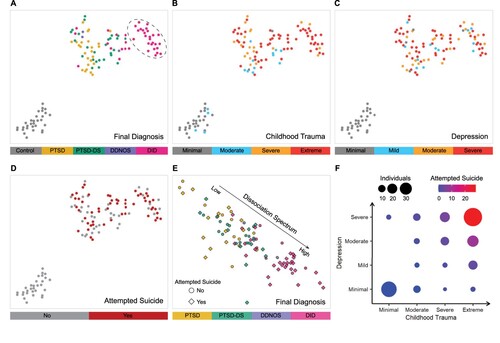
Table 2. Results of the supervised learning modelling tasks using summary psychometrics.
Figure 3. Hybrid supervised learning identifies markers and distinct symptom landscape. (A) Raincloud plot with p-value showing the primary symptom that distinguished the patient and control groups. (B and C) CTQ: Sexual abuse and SCID-D Dissociative Symptoms: Depersonalisation were the top-two metrics that distinguished between the tertiary classification of the three patient groups. On average, individuals with DID reported the most severe histories of childhood sexual abuse and the most extreme depersonalisation symptoms, followed by individuals with PTSD-DS. (D) A scatter plot demonstrated the spectrum of dissociation in patients when MID metrics of Pathological Dissociation: Severe Dissociation and Partially Dissociated Intrusions: Made/Intrusive Actions were considered. Probability densities are displayed on the top and right for each metric. (E) MID Fully-Dissociated Actions: Fugues was identified as the top metric for predicting past suicide attempts. (F) Scatter plot of the top-two metrics for suicide attempts. Thresholds or decision boundaries are displayed with a dashed line. The area greater than the thresholds included most suicide attempts. Probability densities are displayed on the top and right for each metric. MID, Multidimensional Inventory of Dissociation; CTQ, Childhood Trauma Questionnaire; SCID-D, Structured Clinical Interview for DSM-IV Dissociative Disorders revised; PCL-5, PTSD Checklist for DSM 5; PDI, partially-dissociated intrusions; CBP, cognitive and behavioural psychopathology scale.
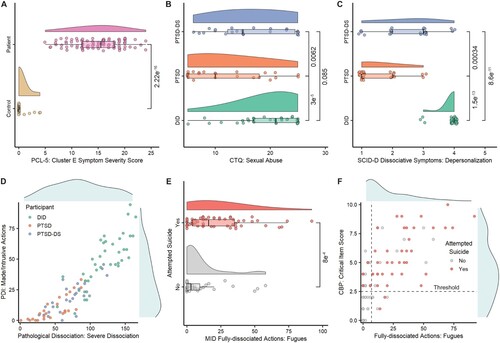
Table 3. Results of the suicide attempt modelling tasks using MID summary metrics.
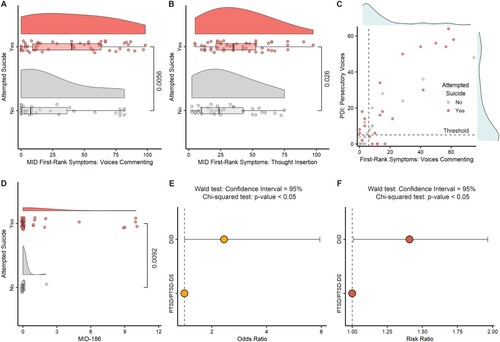
Figure 4. Predictive subscales from the MID and the odds/risk ratio for suicide attempt in the DID sample. (A and B) Raincloud plots showing the top-two metrics identified by the supervised learning model to predict suicide attempt. (C) Scatter plot of the top-two metrics that predicted suicide attempt in the PTSD/PTSD-DS group. Probability densities are displayed on top and right for each metric. (D) Suicide attempt modelling in the patient sample using question-level responses identified the top metric, Question 186: Discovering that you have attempted suicide but having no memory of having done it. (E) Suicide attempt odds ratio analysis for the DID group with a combined PTSD/PTSD-DS group as the reference. (F) Suicide attempt risk ratio analysis for the DID group with PTSD/PTSD-DS group as the reference. MID, Multidimensional Inventory of Dissociation, PDI, partially-dissociated intrusion.
Supplemental Material
Download MS Word (1.4 MB)Data availability statement
The data that support the findings of this study are available from the corresponding author upon reasonable request.