
Figures & data
Table 1. Demographic and clinical characteristics.
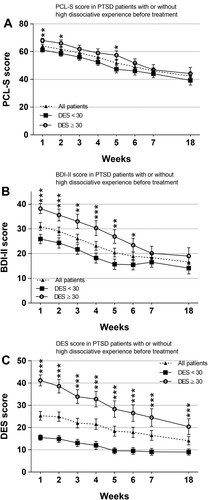
Figure 1. Change over the treatment period in PTSD patient with or without high dissociative experiences before treatment in the (A) PCL-S score, (B) BDI score, and (C) DES score. Mean (± SEM). *p < .05, **p < .01, ***p < .001 between groups of patients with the presence (≥ 30) or absence (< 30) of high dissociative experiences.
Supplemental material