
Figures & data
Figure 1. Seven models tested with ITQ scores. Note: Re = Re-experiencing; Av = Avoidance; Th = Sense of Threat; AD = Affective Dysregulation; NSC = Negative Self Concept; DR = Disturbances in Relationships; DSO = Disturbances in Self-Organization.
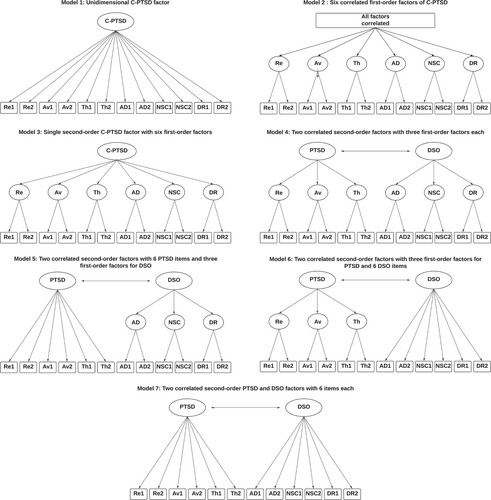
Table 1. Descriptive statistics of aversive experiences measured (n = 750).
Table 2. ITQ French version descriptive statistics and internal consistency (n = 750).
Figure 2. Graphical modeling of the factor structure of Model 4. Note: Re = Re-experiencing; Av = Avoidance; Th = Sense of Threat; AD = Affective Dysregulation; NSC = Negative Self Concept; DR = Disturbances in Relationships; DSO = Disturbances in Self-Organization.
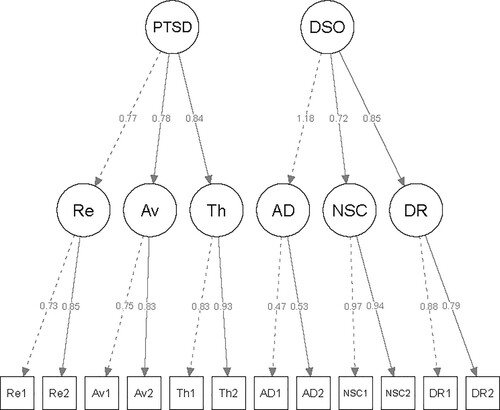
Table 3. Comparison of alternative models of ICD-11 based on ITQ French version‘s results.
Table 4. Standardized factor loadings for Model 4 (six first-order factors, with two correlated second-order factors) (N = 750).
Table 5. Descriptive statistics for every scale used (n = 750).
Table 6. Correlations between ITQ scores and subscales and HADS, WHO-5, PCL-5 and DERS using Spearman’s ρ.
Table 7. Spearman's ρ correlations and intraclass correlation coefficient between the two measurement times at the ITQ scores and subscales (n = 332).
Supplemental Material
Download MS Word (38.5 KB)Data availability statement
The data that support the findings of this study are available from the corresponding author [WP], upon reasonable request.