
Figures & data
Table 1. PTSD Checklist for DSM-5 (PCL-5) item mapping for the Diagnostic and Statistical Manual of Mental Disorders, Fifth Edition (DSM-5) post-traumatic stress disorder (PTSD) factor models.
Figure 1. Receiving operating characteristics (ROC) curve for the PTSD Checklist for DSM-5 (PCL-5) relative to the Clinician-Administered PTSD Scale for DSM-5 (CAPS-5) interview. Accuracy, as represented by the area under the curve, is .79 (95% CI = .69–.89).
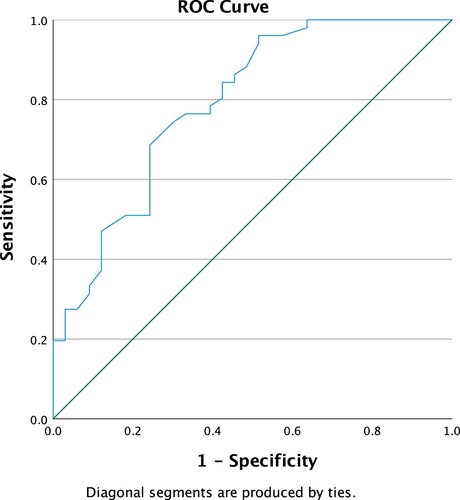
Table 2. Post-traumatic stress disorder (PTSD) prevalence rates for different cut-off scores.
Table 3. Sensitivity, specificity, positive predictive value (PPV), and negative predictive value (NPV) for different cut-off scores.
Table 4. Model fit statistics for the alternative models of Diagnostic and Statistical Manual of Mental Disorders, Fifth Edition (DSM-5) post-traumatic stress disorder (PTSD) symptoms following mixed traumatic exposure and accidents.
Data availability statement
The data used in the present study cannot be shared owing to the EU General Data Protection Regulation.