
Figures & data
Table 1. Inter-correlations between trauma-related symptoms during the peritraumatic phase and the study variables (n = 488).
Table 2. Latent profile analysis fit indices (n = 488).
Figure 1. Centroid values for hyperarousal, avoidance, intrusion and negative alterations in mood and cognition according to profile.
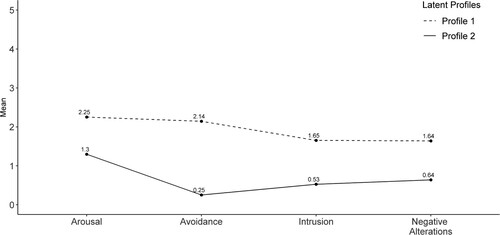
Table 3. Estimates of the contribution of study variables to the probability to belong to profile 1 (high trauma-related symptoms during the peritraumatic phase) (n = 488).
Data availability statement
Due to the nature of this research, participants of this study did not agree for their data to be shared publicly, so supporting data is not available.