
Figures & data
Table 1. Characteristics of participant groups according to timing of exposure to prenatal famine.
Figure 1. Overview of the five identified glucocorticoid receptor haplotypes based on the four investigated common single nucleotide polymorphisms (SNPs) within this gene, and their respective frequencies within the cohort (based on two estimated haplotypes per participant).
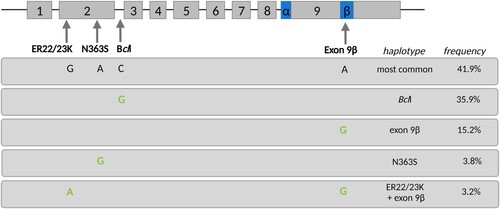
Table 2. Frequencies of haplotype carriers within participant groups according to occurrence and timing of exposure to prenatal famine and according to probable PTSD diagnostic status.
Table 3. Results of linear regression analyses including the effects of GR haplotype carrier status, prenatal famine exposure and childhood trauma on PTSD symptom severity in late adulthood, with separate models for the most common haplotype, the BclI haplotype and the Exon 9β haplotype.
Figure 2. Visualisation of PTSD symptom severity scores as a function of BclI haplotype carrier status, prenatal famine exposure and adulthood trauma. The association between the number of trauma types experienced during adulthood (LEC total score) and PTSD symptom severity (log-transformed PCL-5 total scores) is depicted for each prenatal exposure group and controls separately, divided into non-carriers (left panel) and BclI haplotype carriers (homozygous or heterozygous, right panel).
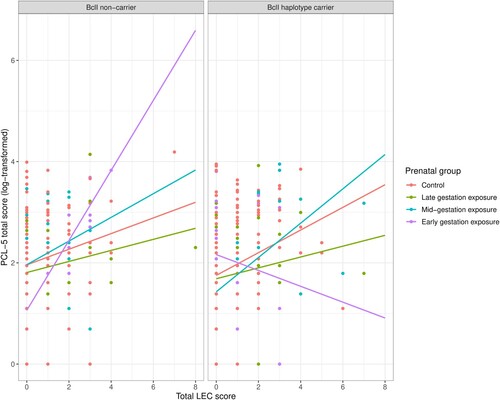
Table 4. Results of linear regression analyses including the effects of GR haplotype carrier status, prenatal famine exposure and adulthood trauma on PTSD symptom severity in late adulthood, with separate models for the most common haplotype, the BclI haplotype and the Exon 9β haplotype.
Supplemental Material
Download MS Word (18.8 KB)Data availability statement
The data that support the findings of this study are available on request from the corresponding author, MVZ. The data are not publicly available as they contain information that could compromise participant privacy.