
Figures & data
Table 1. Sociodemographic characteristics in children and caregivers.
Table 2. Prevalence rates of mental health problems in the child and caregiver samples.
Figure 1. Stacked manhattan plot of retrieved CpGs from EWAS for children. For the sake of illustration, −log10 transformed p-value of each CpG analysed in the two children’s EWAS including either the predictor of war-related trauma load or PTSD symptom severity are plotted in order of its location on the autosome. CpGs on the sex chromosomes were not analysed. The dashed line indicates the array-wide nominal threshold of −log10(9 × 10⁻⁸). There were no significant DMPs associated with any children’s predictor.
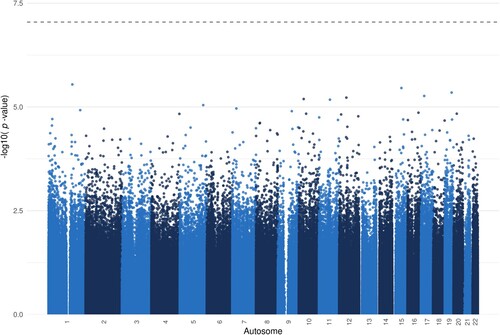
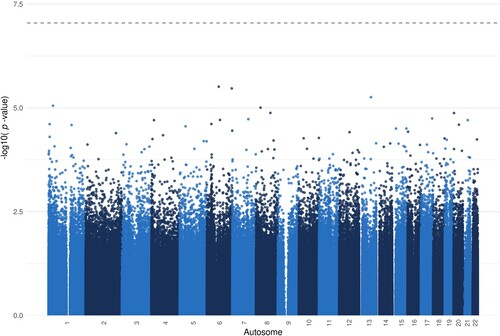
Figure 2. Stacked manhattan plot of retrieved CpGs from EWAS for caregivers. For the sake of illustration, −log10 transformed p-value of each CpG analysed in the two caregivers’ EWAS including either the predictor of war-related trauma load or PTSD symptom severity are plotted in order of its location on the autosome. CpGs on the sex chromosomes were not analysed. The dashed line indicates the array-wide nominal threshold of −log10(9 × 10⁻⁸). There were no significant DMPs associated with any caregivers’ predictor.
Supplemental Material
Download PDF (206 KB)Data availability statement
DNAm and phenotypic data are not publicly available due to de-anonymization risk but available from the corresponding author on reasonable request.