
Figures & data
Table 1. Characteristics of the study sample (N = 223).
Table 2. The perceived readiness to work with trauma-exposed patients scores (N = 159).
Figure 1. Trajectories of the perceived trauma care competencies change after training. Note. PTSD = Posttraumatic stress disorder; RTEPS = Readiness to Work with Trauma-Exposed Patients Scale. Mean values are presented for within-group analysis from pre- to post-training, and from pre-training to follow-up. * p < .05, ** p < .01, *** p < .001.
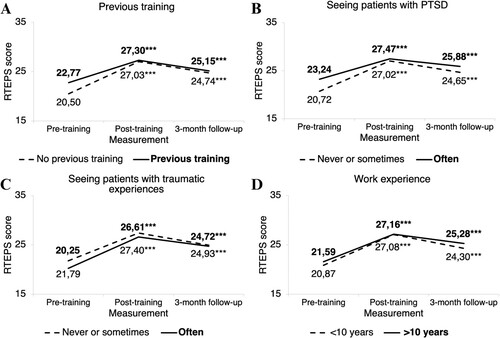
Table 3. Training effects on perceived trauma care competencies (N = 223).
Table 4. Training effect sizes in professionals with various professional experiences (N = 223).
Data availability statement
The detailed sociodemographic information of the dataset does not fully protect the anonymity of the respondents. For this reason, the entire dataset cannot be made publicly available. However, excerpts of the data on a higher aggregation level can be provided upon justified request by the first author, OG.