
Figures & data
Figure 1. Flow diagram for the study selection process.
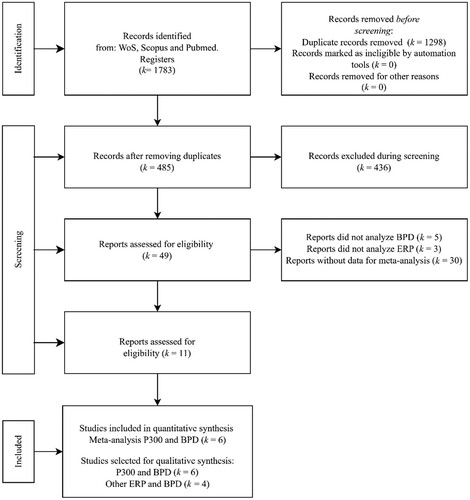
Table 1. Summary of studies relating P300 and BPD symptoms.
Table 2. Quality Assessment Tool for Observational Cohort and Cross-Sectional Studies.
Figure 2. Forest plot for the P300 event-related potential and borderline personality disorder symptoms meta-analysis.
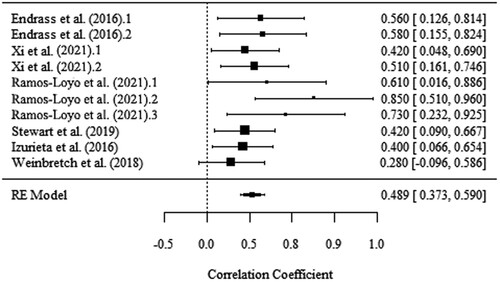
Table 3. Meta-analysis results
Figure 3. Funnel plot for the P300 event-related potential and borderline personality disorder symptoms meta-analysis.
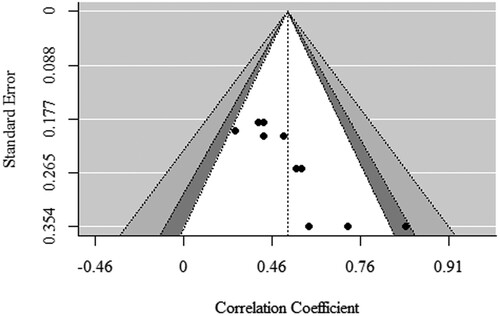
Figure 4. Bubble plot for the P300 event-related potential and borderline personality disorder symptoms meta-regression with Gini as a moderator.
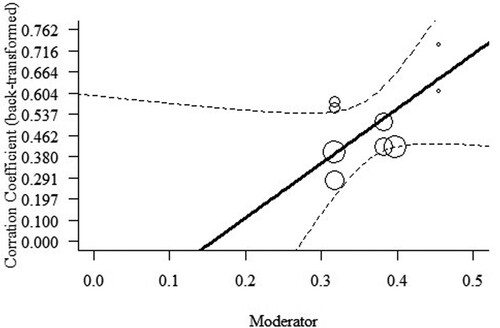
Table 4. Meta-regression results.
Supplemental Material
Download TIFF Image (62.2 KB)Supplementary Table 1.docx
Download MS Word (15.7 KB)Supplementary Figure 1_rev.docx
Download MS Word (164.5 KB)Data availability statement
The data that support the findings of this study are openly available in ‘Mendeley Data’ at http://doi.org/10.17632/m69dtg9vb6.1.