
Figures & data
Table 1. Demographics, Cognitive Abilities, Psychological, Behavioural and Social Functioning in the Maltreated (MT; n = 42) and non-maltreated group (NMT; n = 32).
Figure 1. Mean Intensity Scores for Happy and Fearful Facial Expressions in the MT and NMT. Note. Error bars represent 95% confidence intervals.
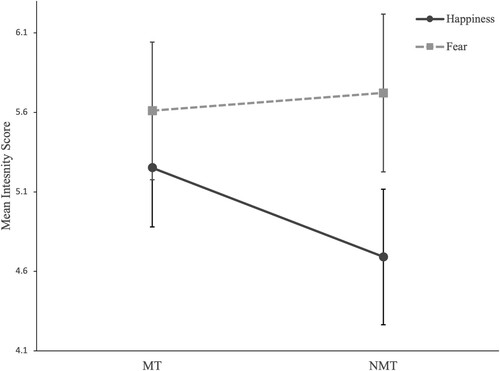
Figure 2. A Mediation Model Depicting the Associations Between Maltreatment Exposure (MT and NMT groups), Mean Intensity Scores for Happy Faces, and Mental Health Symptoms (SDQ Total Score). Note. Coefficient values are standardised; the interaction term (i.e. indirect effect: a x b) significance threshold is measured using bootstrapping (n = 5000, CI = 95%), and heteroscedasticity consistent Huber-White standard error is implemented; N = 74 (MT = 42; NMT = 32); * = statistically significant coefficients.
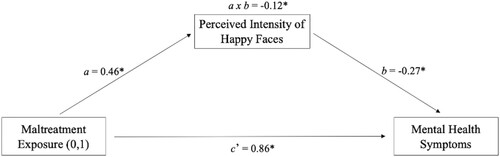
Figure 3. Mean Intensity Scores for Happy Faces are Plotted as a Function of Social Support (CASSS Frequency Scores) and Maltreatment Status (MT and NMT groups).
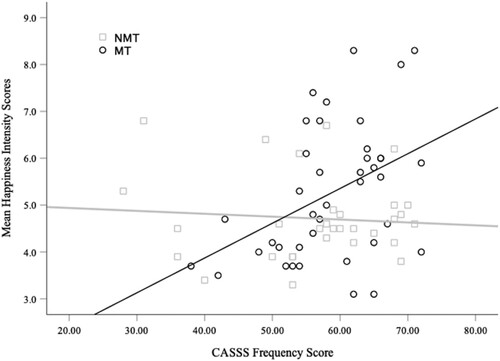
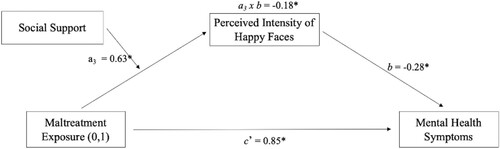
Figure 4. A Moderated-Mediation Model Depicting the Associations Between Maltreatment Exposure (MT and NMT groups), Social Support (CASSS Frequency Scores), Mean Intensity Scores for Happy Faces, and Mental Health Symptoms (SDQ Total Score). Note. Coefficient values are standardised; the moderated-mediation coefficient (i.e. conditional indirect effect: a3 x b) significance threshold is measured using bootstrapping (n = 5000, CI = 95%), and a heteroscedasticity consistent Huber-White standard error is implemented; N = 71 (MT = 40; NMT = 31); * = statistically significant coefficients.
Supplementary_Info_Gerin_et_al_EJPT.docx
Download MS Word (45.5 KB)Data availability statement
The data associated with this study has yet to be made publicly accessible. To discuss access, please contact the Principal Investigator, Professor Eamon McCrory, [email protected].