
Figures & data
Table 1. Description of the sample.
Figure 1. Linear relationship of childhood trauma exposure (A, B; n = 117) and lifetime trauma exposure (C, D; n = 116) and Horvath’s (A, C), and Hannum’s epigenetic age residuals (B, D). CTQ = Childhood Trauma Questionnaire. LEC-R = Life Events Checklist Revised.
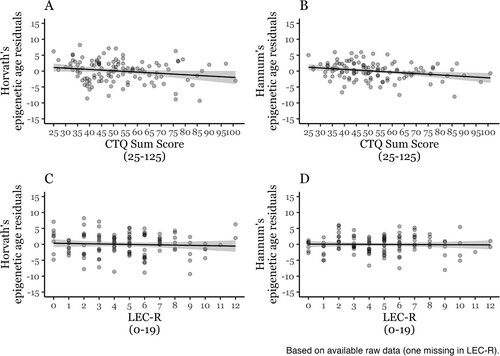
Table 2. Parameters of the regression models predicting epigenetic age residuals from childhood trauma exposure (CTQ) controlled for sex (1 = male, 2 = female), body mass index (BMI), smoking status (1 = current smoker, 2 = never smoker), and proportional white blood cell type estimates. The estimates were pooled across ten imputed datasets. P-values marked with an asterisk survived the α level adjustment for four analyses (α = .0125).
Table 3. Parameters of the regression models predicting epigenetic age residuals from lifetime trauma exposure (LEC-R) controlled for sex, BMI, smoking status, and proportional white blood cell type estimates (imputed data). The estimates were pooled across ten imputed datasets. P-values marked with an asterisk survived the α level adjustment for four analyses (α = .0125).
AgeAccel_ReviewerResponse_20240628.pdf
Download PDF (33.7 KB)Data availability statement
Data are available upon reasonable request.