
Figures & data
Table 1. Sociodemographic and flight-related characteristics for the total sample and clusters.
Table 2. Means, standard deviations, correlations and internal consistency.
Figure 1. Mean symptom scores per cluster.
The figure shows mean scores of PGD, PTSD and depressive symptoms for three clusters. The PGD-cluster is characterised by high scores on PGD symptoms, moderate scores on PTSD symptoms and low scores on depressive symptoms. The PGD/PTSD-cluster has high scores on both PGD and PTSD symptoms and moderate scores on depressive symptoms. The resilient cluster has low scores on all symptoms.
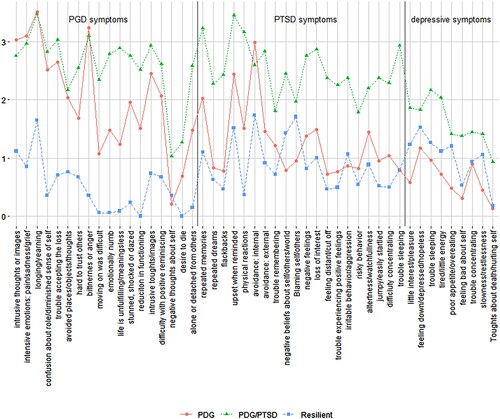
Table 3. Single multinominal logistic regression analyses.
Table 4. Multiple multinominal logistic regression analysis.
Data availability statement
Data are available upon request to the first author.