Figures & data
Table 1. Self-report of childhood trauma (N=46). Counts are overlapping and not unique counts.
Table 2. Presence of Psychopathology (N=46). Counts are overlapping and not unique counts.
Table 3. Results of fMRI analyses on RMET using the contrast mental state > gender and FWE cluster extent threshold at p < .001 (IFG = Inferior frontal gyrus, STG = Superior temporal gyrus, MTG = Middle temporal gyrus).
Figure 1. Whole brain one sample t-test on mental state > gender contrast. FWE cluster extent threshold with p < .001, left = left, MNI −45, 29, 1 (left and middle), MNI 54, −31, 13 (right).
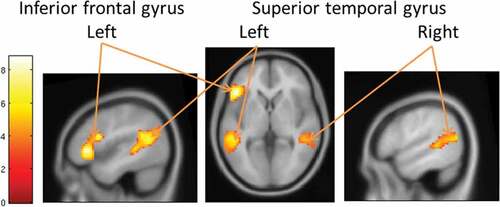
Figure 2. a: Positive relation between SA and left IFG (MNI: −45, 26, 11) resulting from a regression analysis with all subscales (Yellow, FWE cluster extent threshold with p < .001) depicted on whole brain mental state > gender contrast (Red, FWE cluster extent with p < .001). b: Time series of gender and mental state contrast represent the mean activation of the active cluster in the left IFG (MNI: −45, 26, −11) for five volumes (TR = 2.2 s) starting at stimulus onset to four volumes after. The time series covers one trial (8000 ms) and the onset of the next trial (800 ms).
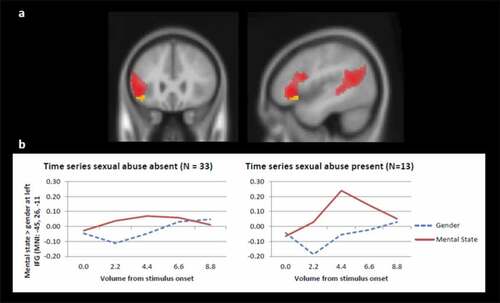
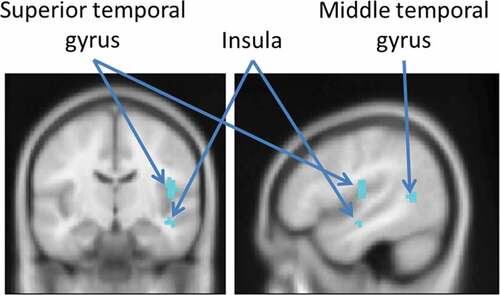
Figure 3. Results of functional connectivity analysis from cluster in left IFG related to SA, cluster extent threshold of 10 voxels and p < .001, MNI: 47, −12, 18, right = right.