Figures & data
Table 1. Characteristics of the sample.
Table 2. Means (SD), and correlations between psychological distress, exposure, and different types of support, t1 ≤ 1.85 (N ≈ 238).
Table 3. Unstandardized parameter estimates and standard errors (SE), and model fit indices for latent growth curve models of psychological distress and social support.
Table 4. Standardized estimates and standard errors (SE) of associations between intercepts (I) and slopes (S) of psychological distress, and direct exposure, sex, and sources of social support measured at T1.
Figure 1. Estimated mean development of psychological distress from 10 months (T1) to three years (T3) after the 2011 Oslo bombing, dependent on level of general social support, when exposure, sex, colleague support, and leader support are controlled for.
*** slope: p < 0.001.
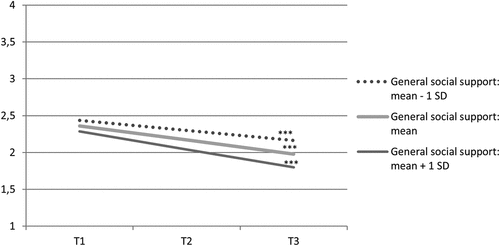
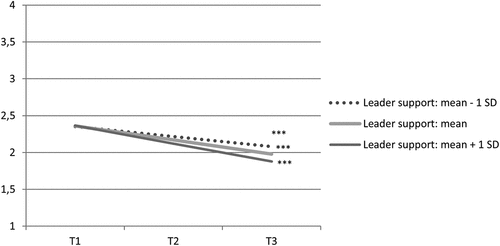
Figure 2. Estimated mean development of psychological distress from 10 months (T1) to three years (T3) after the 2011 Oslo bombing, dependent on level of leader support, when exposure, sex, colleague support, and general social support are controlled for.
*** slope: p < 0.001.