Figures & data
Table 1. PDS item descriptions, Item mapping for the tested models, EFA factor loadings for the Model F, CFA standardized factor loadings and Squared multiple correlations for the Model F.
Table 2. Correlations of the Posttraumatic Diagnostic Scale (PDS) with validity measures (N = 829).
Table 3. Agreement of PDS and SCID diagnoses for birth-related PTSD.
Table 4. Psychometric properties of PDS relative to the SCID diagnosis of PTSD after birth.
Table 5. Fit indices for the six proposed models.
Figure 1. Group differences in PDS and its subscales between women with PTSD (n = 52) and without (n = 82) diagnosed by SCID. Bars represent means of total symptom severity for PDS and each subscale.
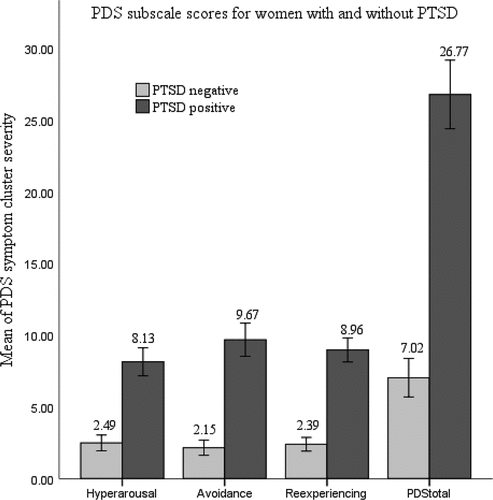
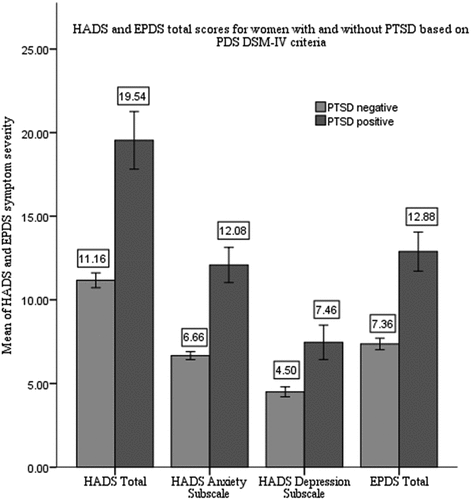
Figure 2. Group differences between participants with and without PTSD according to PDS at 6-months postpartum. Group differences in EPDS and HADS along with its subscales between women with PTSD (n = 94) and without (n = 735) diagnosed by PDS. Bars represent means of total symptom severity for EPDS and HADS.