
Figures & data
Figure 1. Stimuli are photos of participant (‘Self’) or a stranger (‘Other’) in neutral expression, and positive/negative words. A single block involves presenting five face–word pairings as shown, preceded by a fixation cross (+) for 12 s and the capitalized word ‘SELF’ or ‘OTHER’ for 3 s, depending on whether their own or the stranger’s picture will be presented in the upcoming block. Participants are asked to silently rehearse the statements ‘I am’ or ‘She is’ when they view the Self and Other faces, respectively, and read the words, thus associating the self/other with positivity or negativity. Participants press a response button after silently rehearsing each statement and their reaction time is recorded.
Table 1. Demographic and psychological characteristics.
Figure 2. Group differences in self-report and behavioural response to the VV-SORP-T. C = Controls, PTSD = Posttraumatic Stress Disorder, SN = Self-Negative, SP = Self-Positive, ON = Other-Negative, OP = Other-Positive, NA = Negative Affect, PA = Positive Affect, RT = Reaction Time. * group difference at p < .05. In the case of survey response, the y-axis is the sum across 10 words referring to how well each word described how participants think about themselves or others, as indicated, on an 11-point scale (0–10) with (0) referring to ‘Not at all’, (5) being ‘Moderately’, and (10) being ‘Completely’. In the case of NA and PA, the y-axis indicates participants’ mean rating on a percentage rating scale (0% referring to ‘Not at all’, 50% indicating ‘Moderately’, and 100% indicating ‘Strongly’) referring to how much they felt ‘anger’, ‘sadness’, ‘anxiety-fear’, ‘disgust’, and ‘bad about self’, in the case of NA, and ‘happy’ and ‘good about self’, in the case of PA. Finally, in the case of RT, the y-axis refers to the obtained response time in msec multiplied by 0.10 in order to conform to the 0–100 scale fitting of the self-report measures.
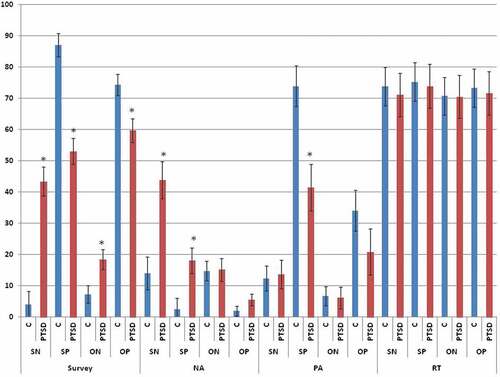
Figure 3. Coloured visualization of independent components. Transverse slices (top row) shown at −15, −3, +15, and +30 mm as per the axial slice. Axial slices (middle row) shown at 0 and +40 (right hemisphere) as per the coronal slice. Six independent components were analysed for group differences as follows: Occ. = Occipital cortex (purple), MLPC = mediolateral parietal cortex (yellow), MTL = medial temporal lobe (green), D-MPFC = dorsal medial prefrontal cortex (blue), M-MPFC = middle medial prefrontal cortex (brown), V-MPFC = ventral medial prefrontal cortex (red).
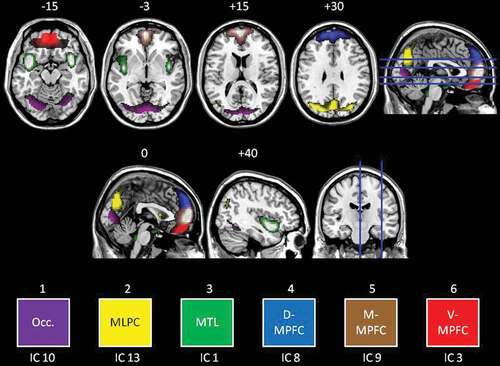
Table 2. Significant differences in the neural activity of the ICs in relation to the tasks, in PTSD as compared to controls.