Figures & data
Table 1. Proportion of participants who answered the re-experiencing symptoms among Japanese participants with and without PTSD.
Table 2. Characteristics of the study participants.
Table 3. Discriminative values (95% CI), symptom severity correlation coefficients (Pearson’s r), and reliability coefficients (Cronbach’s alpha) of different candidates of the PDS 2- or 3-item scale applied to Japanese participants with and without PTSD.
Table 4. Diagnostic validity (AUC) and symptom severity correlation coefficients (Pearson’s r) for different candidate PDS 2- and 3-item scales applied to Japanese participants with and without PTSD, calculated separately with clinical, university, and female subsamples.
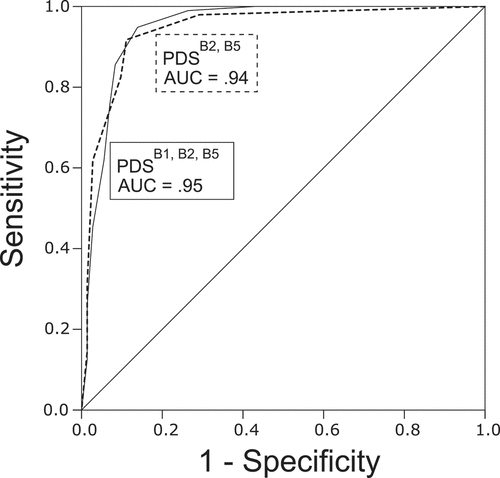
Figure 1. Receiver operating characteristic (ROC) curve depicting the sensitivity and specificity of the brief version of the PDS in identifying individuals with PTSD, as determined through the CAPS (DSM-IV) interview. Area under the curve (AUC) was .95 (3-item version) and .94 (2-item version). PDS, Posttraumatic Diagnostic Scale; PTSD, posttraumatic stress disorder; CAPS, Clinician-Administered PTSD Scale; DSM-IV, Diagnostic and Statistical Manual of Mental Disorders, 4th ed.