
Figures & data
Table 1. Sociodemographic background data.
Table 2. Descriptive data of study variables.
Table 3. Bivariate, zero order correlation of events, peritraumatic reactions and symptoms.
Figure 1. Mediation of the association between trauma exposure and trauma symptoms by peritraumatic reactions. Unstandardized B coefficients are displayed with t and p values. Trauma exposure indicates total trauma exposure measured by the JVQ lifetime total scale, trauma symptoms indicates total score from the TSCC, peritraumatic reactions are measured by peritrauma total scale. Path c indicates the association between trauma exposure and trauma symptoms without the inclusion of a mediator. Path c´ indicates the direct effect, i.e. controlling for the mediator in the model. Paths a, b and c are significant as evidence by p ≤ .01. The ‘t’ statistic is computed by dividing the estimated value of the parameter by its standard error. This statistic is a measure of the likelihood that the actual value of the parameter is not zero. The larger the absolute value of t, the less likely that the actual value of the parameter could be zero.
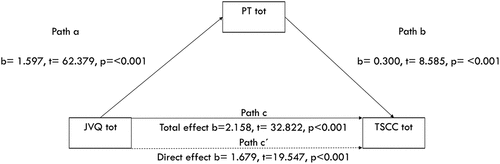
Figure 2. Mediation of the association between trauma exposure and trauma symptoms by peritraumatic reactions. Unstandardized B coefficients are displayed with t and p values. Trauma exposure indicates total trauma exposure measured by the JVQ lifetime total scale, trauma symptoms indicates total score from the TSCC, peritraumatic reactions are measured by peritrauma scales. Path c indicates the association between trauma exposure and trauma symptoms without the inclusion of a mediator. Path c´ indicates the direct effect, i.e. with the mediator. Paths a, b and c´ are significant as evidence by p ≤ .01. The ‘t’ statistic is computed by dividing the estimated value of the parameter by its standard error. This statistic is a measure of the likelihood that the actual value of the parameter is not zero. The larger the absolute value of t, the less likely that the actual value of the parameter could be zero.
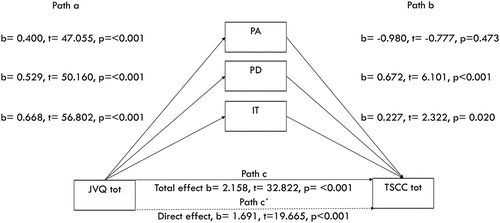
Table 4. Separated mediating models for males/females with TSCC tot, TSCC dis and TSCC pts as dependent variables and JVQ as independent variable. First model with PT total, then separating the different mediating factors PA, PD and IT.