Figures & data
Table 1. Parent participants according to their own and their children’s posttraumatic stress.
Figure 1. Overview of hierarchical regressions for parent primary healthcare consumption (frequency of GP visits).
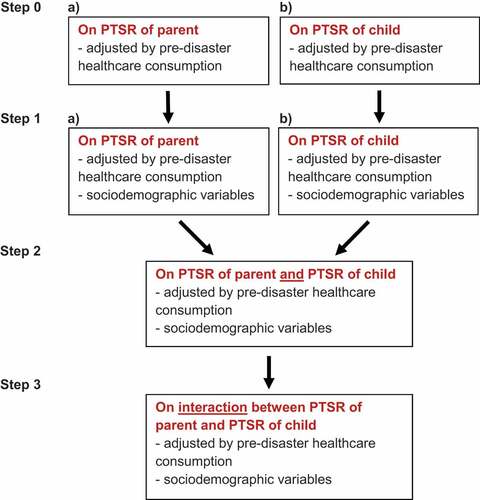
Figure 2. Observed post-disaster frequency of GP visits in mothers (red) and fathers (blue) in the early (A) and delayed (B) aftermath, according to parents’ own PTSD classification. Panels A and B are drawn to scale in respect to annual rates, as indicated by the axis between the two panels. The width of the coloured boxes is proportional to the number of individuals within the subgroup. The corresponding pre-disaster values (white boxes) are included for reference purposes only.
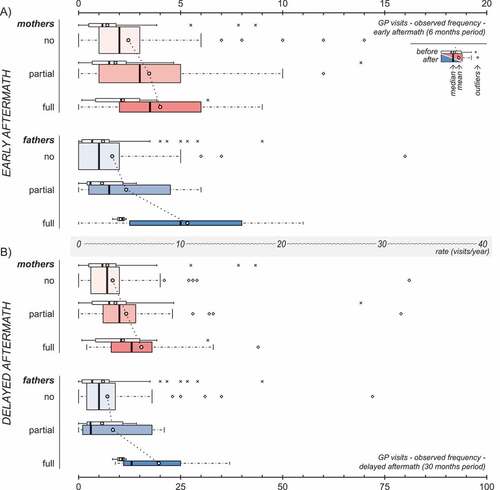
Figure 3. Observed post-disaster frequency of GP visits in mothers (red) and fathers (blue) in the early (A) and delayed (B) aftermath, according to the PTSD classification of their children. Panels A and B are drawn to scale in respect to annual rates, as indicated by the axis between the two panels. The width of the coloured boxes is proportional to the number of individuals within the subgroup. The corresponding pre-disaster values (white boxes) are included for reference purposes only.
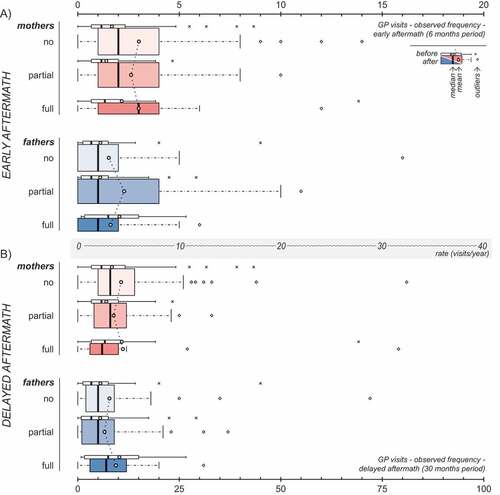
Figure 4. Frequency of GP visits in mothers and fathers in the early (A) and delayed (B) aftermath of the Utøya attack related to the parents’ own and their children’s early PTSR (estimated rate ratios (RR) with 95% confidence intervals). Hierarchical negative binomial regressions. Step 1: Regressions of parent and child PTSR in separate models, each adjusted for pre-disaster frequency of GP visits and socio-demography. Socio-demography shown in the chart stems from regressions of parent PTSR. Step 2: Regression of parent and child PTSR in a mutually adjusted model, including all variables from the previous step. All regressions were offset for observation time (non-admittance to hospital). Only individuals with no missing values were included. Horizontal dotted line: no relationship (RR = 1). Complete numerical figures available in Supplemental data Table 3.
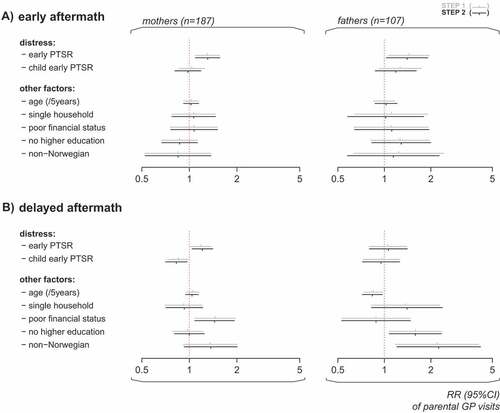
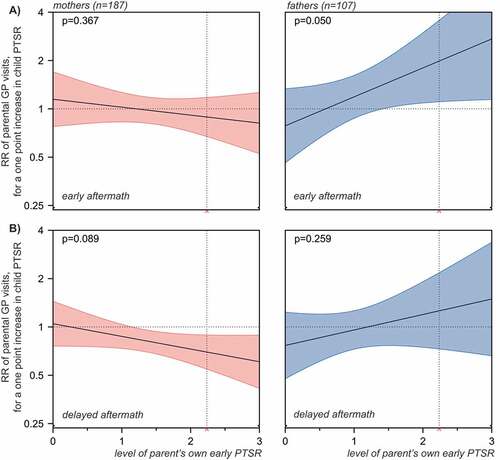
Figure 5. GP visits in mothers (red) and fathers (blue) related to interaction between parent and child early PTSR. The panels present the associations between frequency of parent’s GP visits and their child’s PTSR, across low through high levels of parent’s own early PTSR, in the early (A) and delayed (B) aftermath of the Utøya terrorist attack. The horizontal dotted line indicates no relationship (rate ratio = 1). The 95% confidence intervals of rate ratios for parents’ GP visits are visualized by colour shaded areas. For values of parent PTSR, where no overlap between the line of no relationship and the confidence intervals is observed, significant associations between child PTSR and the frequency of parental GP visits are indicated by the model. The vertical dotted line indicates the cut-off for probable PTSD diagnosis on the scale (mean PTSR score = 2.24, included for reference purposes only). P-values are overall estimates for interaction of each model.