
Figures & data
Figure 1. The hypothesized model.
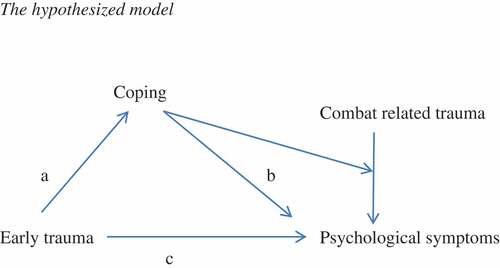
Table 1. Demographic characters of participants (male, N = 932).
Table 2. Results for the c-path F-test of regressions onto ETISR-SF per SCL-90 subscale.
Table 3. Regression coefficients for the a-path per ETISR-SF-subscale on Self-blame.
Table 4. Results for the b-path on General anxiety.
Table 5. Results for the b-path on Symptoms of depression.
Table 6. Results for the b-path on Interpersonal sensitivity.
Supplemental material