
Figures & data
Table 1. Sample characteristics.
Table 2. Goodness-of-fit statistics for one- to six-class models (N = 803).
Table 3. Probability estimates of symptom endorsement for all participants and per class (N = 803).
Figure 1. Estimated post-traumatic stress disorder (PTSD) and complicated grief (CG) symptom probabilities for the five-class latent class analysis solution.
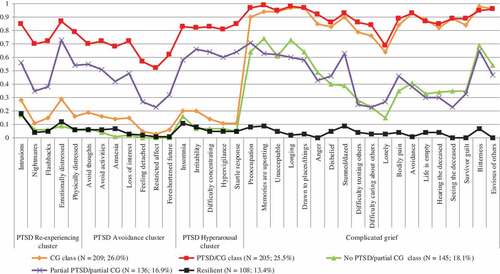
Table 4. Univariate differences in complicated grief (CG) and post-traumatic stress disorder (PTSD) symptom levels between the classes (N = 803).
Table 5. Parameter estimates for the latent class model with covariates included simultaneously (N = 699a).