Figures & data
Figure 1. Schematic illustration of the theoretical framework concerning the relationship between sense of coherence and health outcomes, especially post-traumatic stress disorder (PTSD) symptom severity.
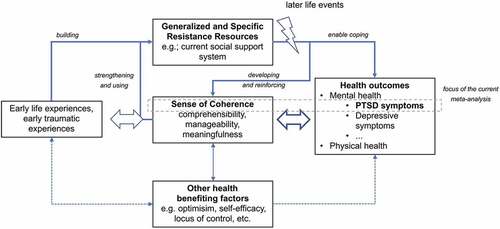
Figure 2. Search terms and search engines, as well as hits per included database.
Figure 3. Flowchart of the study selection process, adapted from the Preferred Reporting Items for Systematic Reviews and Meta-Analyses (PRISMA) group (Moher et al., Citation2009).
Table 1. Included samples and their characteristics.
Table 2. Results of the main analyses and nominally scaled moderator variables.
Table 3. Results for the interval scaled moderator variables.
Table 4. Pearson correlations of the moderator variables (outliers excluded).
Figure 4. Forest plot of the meta-analysis including all samples.
Figure 5. Results of the influence statistics as the basis for outlier identification. The outliers identified by the influence analyses are marked by a circle. Study numbers correspond to those in the forest plot.
Figure 6. Trim-and-fill funnel plot of the main analysis with all samples including the amended effect sizes (white points).
Table A1. Included samples and their characteristics.
Table C1. Results of the main analyses and nominally scaled moderator variables (outliers included).
Table C2. Results for the interval scaled moderator variables (outliers included).
Figure C1. Moderating effect of age on the relationship between sense of coherence and post-traumatic stress disorder (PTSD) symptoms. Smaller dots indicate larger standard errors, i.e. more precise findings are shown as larger dots.