
Figures & data
Figure 1. Cost-utility of QALY gain in main analysis (EM) after bootstrapping (n = 2500) comparing EMDR and PE to WL: ICUR planes and acceptability curves.
Abbreviations: CAU = care as usual; EMDR = eye movement desensitization and reprocessing; ICUR = incremental cost-utility ratio; PE = prolonged exposure; QALY = Quality Adjusted Life Year; Q1 = Quadrant 1 (more effective, more expensive); Q2 = Quadrant 2 (the inferior quadrant: less effective, more expensive); Q3 = Quadrant 3 (less effective, less expensive); Q4 = Quadrant 4 (the dominant quadrant: more effective, less expensive); WL = waiting list.
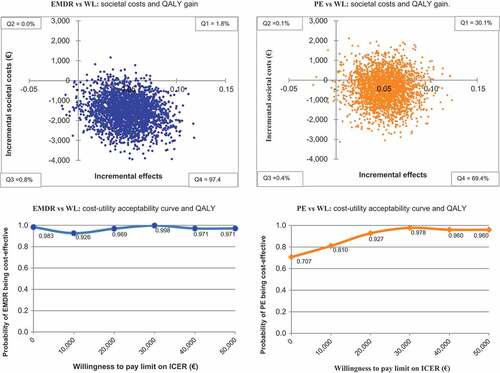
Table 1. Baseline characteristics of the intention-to-treat sample for the three conditions with costs under expectation maximization imputation (N = 155).
Table 2. Results of main analysis and sensitivity analyses.
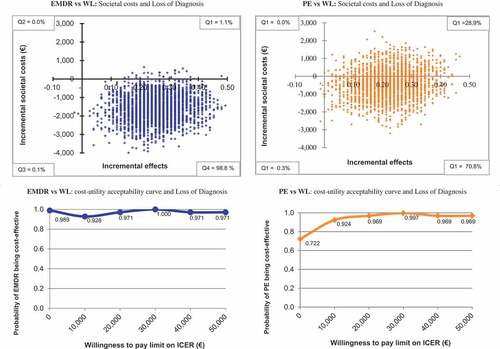
Figure 2. Cost-effectiveness of PTSD loss of diagnosisa in main analysis (EM) after bootstrapping (n = 2500) comparing EMDR and PE to WL: ICER planes and acceptability curves.
Abbreviations: CAU = care as usual; EMDR = eye movement desensitization and reprocessing; ICER = incremental cost-effectiveness ratio; PE = prolonged exposure; PTSD = posttraumatic stress disorder; QALY = Quality Adjusted Life Year; Q1 = Quadrant 1 (more effective, more expensive); Q2 = Quadrant 2 (the inferior quadrant: less effective, more expensive); Q3 = Quadrant 3 (less effective, less expensive); Q4 = Quadrant 4 (the dominant quadrant: more effective, less expensive).a ‘PTSD loss of diagnosis’ indicates the combination of no longer meeting CAPS IV-PTSD criteria + CAPS IV-severity score < 45.
Supplemental material