Figures & data
Table 1. Socio-demographic characteristic for the sample.
Figure 1. Changes in behavioural responses during extinction before and after recovery.
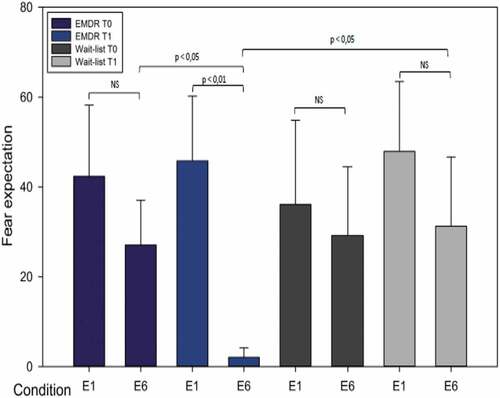
Table 2. Fear expectations during the fear condition and extinction protocol for the two groups before (T0) and after (T1) EMDR therapy.
Figure 2. Brain representation of the significant clusters for the EMDR group (T1 (E1(CS+ vs CS-)-E6(CS+ vs CS-)))-T0(E1(CS+ vs CS-)-E6) minus wait-list group (T1 (E1(CS+ vs CS-)-E6(CS+ vs CS-)))-T0(E1(CS+ vs CS-)-E6) contrast. (a): right amygdala; left amygdala and hippocampus. (b): right BA8. (c): right BA47 and insula. (d): left Heschl gyrus. (e): left BA31. The factorial design analysis has evidenced six significant clusters when considering the EMDR group vs the Wait-List group for the contrast after minus before therapy for early E1 minus late E6 (CS+ minus CS-). Significance level was defined as cluster p-values < .05 after correction for family-wise error (FWE).
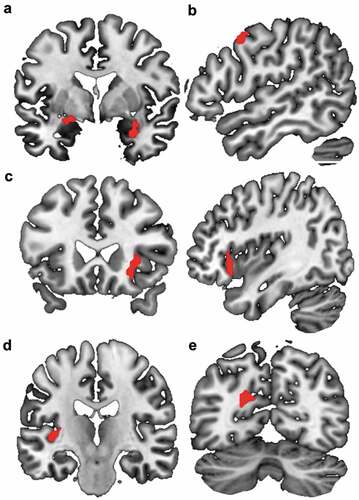
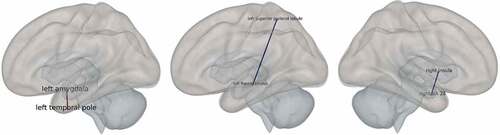
Figure 3. Functional connectivity.Positive connectivity After treatment, at the end of the extinction the left amygdala in the EMDR group shows an increase of its connectivity with the left posterior division of the inferior temporal gyrus, a part of the temporal pole (F = 0.87; intensity = 4.41; p FDR < .022) compared to the wait-list group. Lateral and anterior view. Negative connectivity After treatment, at the end of the extinction, the left hippocampus in the EMDR group shows a decrease of its connectivity with the left superior parietal lobule (F = 1.13; intensity = 4.73; p FDR < .01) compared to the wait-list group. Lateral and anterior view. After treatment, at the end of the extinction, the right insula in the EMDR group shows a decrease of its connectivity with the right ventral entorhinal cortex (BA 28) (F = 1.95; intensity = 4.8; p FDR < .008) compared to the wait-list group. Anterior and lateral view. Fear extinction learning improvement in PTSD after EMDR therapy: an fMRI study.