
Figures & data
Figure 1. Example of emotional images from dot probe with visual gaze pattern, as captured by eye tracking device, superimposed.
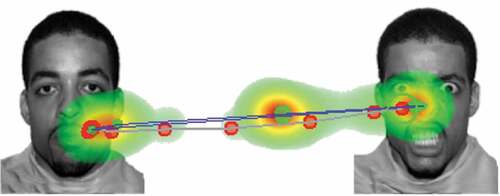
Table 1. Descriptive details for variables of interest.
Table 2. Mean differences across initial fixation and dwell duration toward angry faces and PTSD diagnosis based on Analysis of Variance results.
Table 3. Bivariate correlations between trauma load and current PTSD symptom clusters with difference scores for mean initial fixation and dwell duration of viewing angry faces compared to neutral faces.
Table 4. Hierarchical linear regression predicting mean initial fixation and dwell duration difference scores for angry faces by trauma load and PTSD symptoms.
Supplemental material