Figures & data
Figure 1. Selection process of the participants groups.
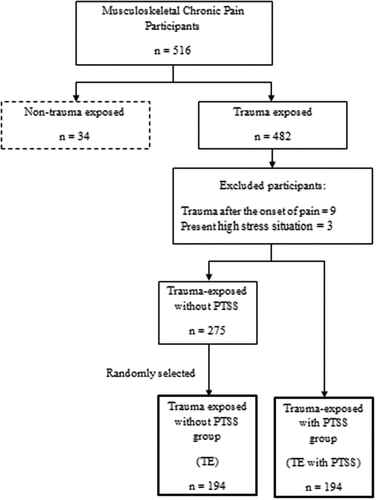
Figure 2. Graphic representation of the study hypotheses.
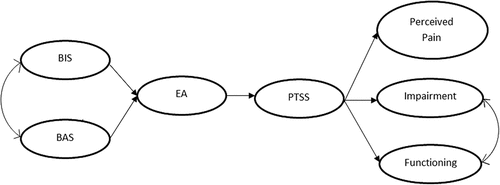
Table 1. Demographic and clinical characteristics of the two groups of participants.
Table 2. Descriptive statistical for both groups of participants.
Table 3. Differences between groups (TE and TE with PTSS) in dependent variables.
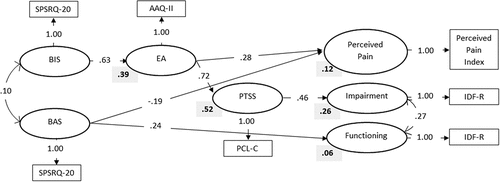
Figure 3. Structure standardized coefficients (in the arrows) and R2 values (bold) for the final model. Observed variables are represented by square and latent variables by circles. SPSRQ-20 = Sensitivity to Punishment and Sensitivity to Reward Questionnaire; AAQ-II = Acceptance and Action Questionnaire-II; PCL-C = Posttraumatic Stress Disorder Checklist-Civilian Version; IDF-R = Impairment and Functioning Inventory Revised.