Figures & data
Table 1. Demographic data of participants at baseline.
Table 2. Comparison of clinical variables for the two groups (EMDR and TAU).
Table 3. Comparison between T0 and T1 of clinical variables for the two groups (EMDR and TAU).
Table 4. Multivariable linear regression models for each clinical score at T1. β values regard the effect of receiving EMDR (vs. TAU).
Figure 1. T0 vs. T1 power spectral density analysis (PSD).
(Middle) Topographic representation of the permutation t-test for delta plus theta bands (T0 vs. T1). (Left) PSD of channel P3 for the TAU and EMDR groups for T0 (blue line) and T1 (red line). (Right) PSD of channel P08 for the TAU and EMDR groups for T0 (blue line) and T1 (red line). For both left and right panel solid horizontal black line (area highlighted in grey) indicate significant difference between T0 and T1 (p < .05).
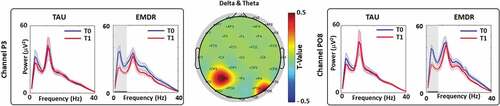
Figure 2. T0 vs. T1 EMDR PSD difference localization analysis.
Position of the equivalent current dipole (ECD) superimposed on the MNI brain template and Brodmann areas template (within MRICron software – www.mricro.com) are shown. Axial, coronal, and sagittal views are shown for the Angular Gyrus (left panel) and Fusiform Gyrus (right panel) PSD difference between T0 vs. T1 EMDR group. Talairach (x, y, z) coordinates as well as MNI coordinates and Broadman areas (BAs) are also shown.
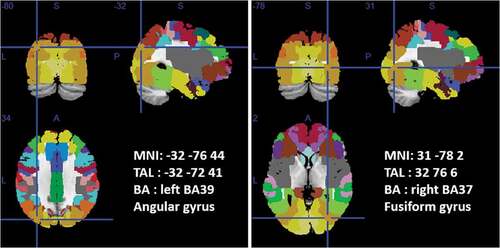
Figure 3. Correlation analysis.
(Upper row – left) Pearson correlation analysis between Δ(PSDdelta) channel P3 and Δ(IES TOT), Δ(CAPS TOT) and Δ(BDI). (Upper row – right) correlation analysis between Δ(PSDtheta) same channel and Δ(IES TOT). (Lower row – left) Pearson correlation analysis between Δ(PSDdelta) channel PO8 and Δ(IES TOT), Δ(CAPS TOT) and Δ(BDI). (Lower row – right) correlation analysis between Δ(PSDtheta) same channel and Δ(IES TOT). Correlation R value and p value were reported on the top right corner of each panel.