
Figures & data
Table 1: Types of resources.
Table 2: Sample descriptive information and drop-out analysis.
Table 3. Zero-order correlation of variables in the model.
Table 4. Means and variances of latent differences constructs.
Table 5. Standardised regression coefficients in single multivariate regression models predicting latent difference scores in PTS and depression symptoms and life satisfaction with latent difference scores in resources.
Figure 1. Standardised coefficients in multiple multivariate regression model predicting latent difference scores in PTS and depression symptoms and life satisfaction with latent difference scores in resources.
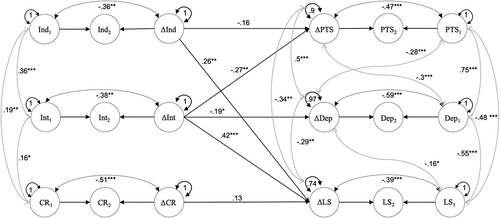
Table A1. Model fit results for testing measurement invariance across measurement points for constructs in the model.