
Figures & data
Figure 1. Latent class model for PTSD and CPTSD in 2008 with predictors (1991) and distal outcomes (2015).
Table 1. Items representing PTSD and CPTSD.
Table 2. Rates of Endorsement of each PTSD and DSO Symptom Clusters.
Table 3. Fit Statistics for Latent Class Analysis of PTSD and DSO Symptom Clusters.
Figure 2. Three-class LCA profile plot.
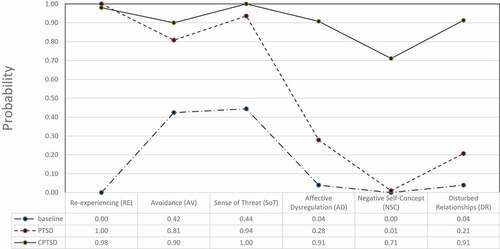
Table 4. Results from multinomial logistic regression predicting latent classes (2008).
Table 5. Distal Outcome Differences across Latent Classes.