
Figures & data
Table 1. The means (SDs) for the 9 studied PTSD symptoms at the first and the last week.
Figure 1. The temporal network of PTSD symptoms. Arrows represent temporal prediction. Thickness of an edge represents the strength of connection. Green edges represent positive connections and red edges represent negative connections.
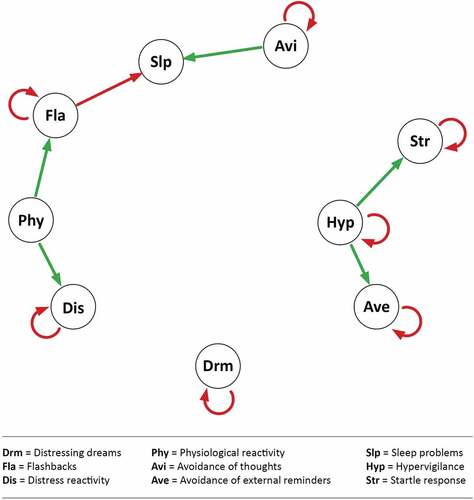
Figure 2. The contemporaneous network of PTSD symptoms. Thickness of an edge represents strength of connection. Green edges represent positive connections and red edges represent negative connections.
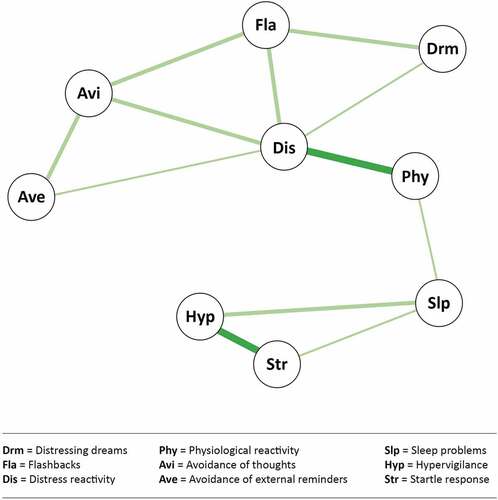
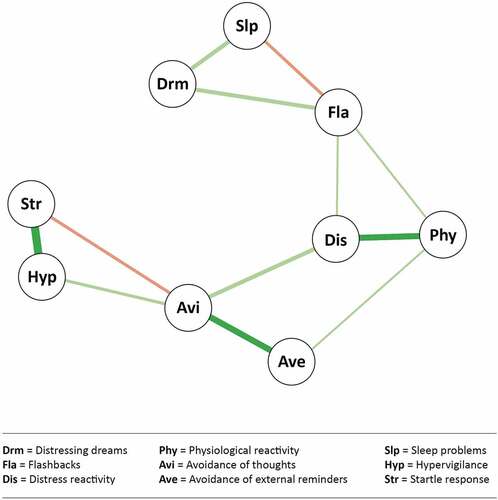
Figure 3. The between-person network of PTSD symptoms. Thickness of an edge represents strength of connection. Green edges represent positive connections and red edges represent negative connections.
Supplemental material