
Figures & data
Figure 1. Standardized coefficients for autoregressive cross-lagged panel model on the initial (MRS I) sample. Observed variables are indicated by rectangular nodes, while latent constructs are indicated by oval-shaped nodes. Observed variables B1-C1 indicate specific items from Clinician Administered PTSD Scale (CAPS), DSM IV version (see PCA results for specific items). Modelled correlated error for repeated measures has been omitted for clarity of presentation (values range .04 – .33). Modelled correlated error between latent constructs at 3 and 6-month time points has likewise been omitted for clarity (values .4 and .33, respectively). * = p < .05, ** = p < .001.
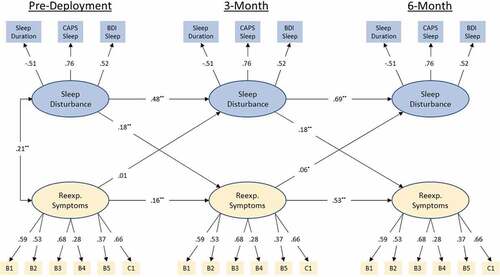
Figure 2. Standardized coefficients for the replicated (MRS II) autoregressive cross-lagged panel model. Observed variables are indicated by rectangular nodes, while latent constructs are indicated by oval-shaped nodes. Observed variables B1-C1 indicate specific items from Clinician Administered PTSD Scale (CAPS) DSM IV version (see PCA results for specific items). Modelled correlated error for repeated measures has been omitted for clarity of presentation (values range −.03 – .43). Modelled correlated error between latent constructs at post-deployment has likewise been omitted for clarity (.35). ** = p < .001.
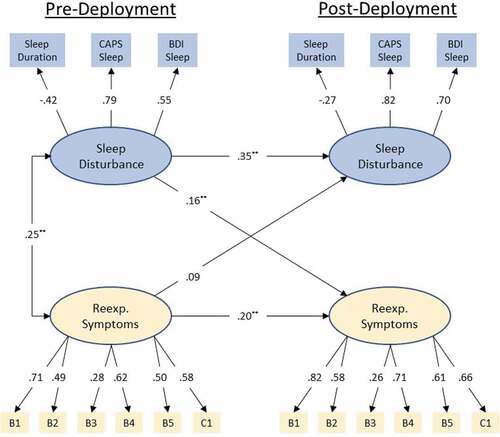
Figure 3. Standardized coefficients for the initial (MRS I) moderation model-predicting re-experiencing symptoms at 3-month from re-experiencing symptoms at pre-deployment, sleep disruption at pre-deployment, combat-stress experience, and the interaction between pre-deployment sleep disruption and combat stress. Observed variables are indicated by rectangular nodes, while latent constructs are indicated by oval-shaped nodes. Observed variables B1-C1 indicate specific items from Clinician Administered PTSD Scale (CAPS) DSM IV version (see PCA results for specific items). Indicators of the interaction construct represent the residual of the product of the two items multiply regressed on both individual items in order to isolate variance accounted for by the interaction. * = p < .05, ** = p < .001.

Figure 4. Standardized coefficients for the initial (MRS I) moderation model-predicting re-experiencing symptoms at 6-month from re-experiencing symptoms at pre-deployment, sleep disruption at pre-deployment, combat-stress experience, and the interaction between pre-deployment sleep disruption and combat stress. Observed variables are indicated by rectangular nodes, while latent constructs are indicated by oval-shaped nodes. Observed variables B1-C1 indicate specific items from Clinician Administered PTSD Scale (CAPS) DSM IV version (see PCA results for specific items). Indicators of the interaction construct represent the residual of the product of the two items multiply regressed on both individual items in order to isolate variance accounted for by the interaction. * = p < .05, ** = p < .001.
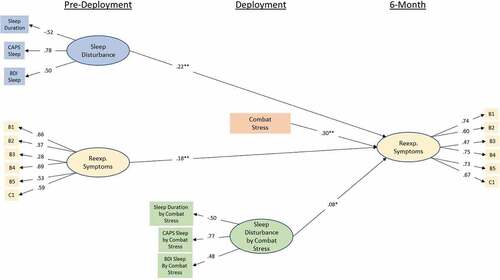
Figure 5. Standardized coefficients for the replicated (MRS II) moderation model predicting re-experiencing symptoms at post-deployment from re-experiencing symptoms at pre-deployment, sleep disruption at pre-deployment, combat-stress experience, and the interaction between pre-deployment sleep disruption and combat stress. Observed variables are indicated by rectangular nodes, while latent constructs are indicated by oval-shaped nodes. Observed variables B1-C1 indicate specific items from Clinician Administered PTSD Scale (CAPS) DSM IV version (see PCA results for specific items). Indicators of the interaction construct represent the residual of the product of the two items multiply regressed on both individual items in order to isolate variance accounted for by the interaction. ** = p < .001.
