
Figures & data
Figure 1. Flow diagram of the study selection process. PTSD = Posttraumatic stress disorder. Adapted from ‘preferred reporting items for systematic reviews and meta-analyses: The PRISMA statement’ (Moher, Liberati, Tetzlaff, Altman, & the PRISMA group, Citation2009).
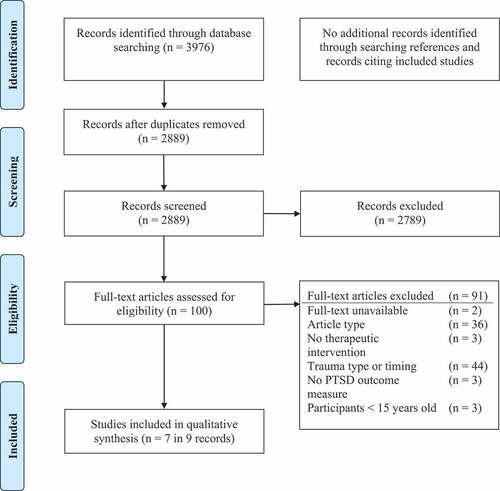
Table 1. Characteristics of included studies.
Figure 2. Risk of bias summary of included studies. The minus sign represents a high risk of bias, the plus sign a low risk of bias, and the question mark an unclear risk of bias. Produced using Review Manager (RevMan) [Computer program]. Version 5.3. Copenhagen: The Nordic Cochrane Centre, The Cochrane Collaboration, 2014.
![Figure 2. Risk of bias summary of included studies. The minus sign represents a high risk of bias, the plus sign a low risk of bias, and the question mark an unclear risk of bias. Produced using Review Manager (RevMan) [Computer program]. Version 5.3. Copenhagen: The Nordic Cochrane Centre, The Cochrane Collaboration, 2014.](/cms/asset/8f0a16b7-4413-48d0-bf38-7037f2b9a042/zept_a_1682932_f0002_oc.jpg)
Table 2. Effects of interventions of included studies.
Figure 3. Forest plot of comparison: intervention versus standard care. Outcome: severity of PTSD symptoms at first follow-up. The first follow-up post-intervention was: for Resnick et al. (Citation2007) six weeks, for Rothbaum et al. (Citation2012) 4 weeks, for Miller et al. (Citation2015) 2 weeks and for Nixon et al. (Citation2016) 1 week. Produced using Review Manager (RevMan) [Computer program]. Version 5.3. Copenhagen: The Nordic Cochrane Centre, The Cochrane Collaboration, 2014.
![Figure 3. Forest plot of comparison: intervention versus standard care. Outcome: severity of PTSD symptoms at first follow-up. The first follow-up post-intervention was: for Resnick et al. (Citation2007) six weeks, for Rothbaum et al. (Citation2012) 4 weeks, for Miller et al. (Citation2015) 2 weeks and for Nixon et al. (Citation2016) 1 week. Produced using Review Manager (RevMan) [Computer program]. Version 5.3. Copenhagen: The Nordic Cochrane Centre, The Cochrane Collaboration, 2014.](/cms/asset/ebfade93-56b4-4e53-b17f-5d3c26072f49/zept_a_1682932_f0003_oc.jpg)
Figure 4. Forest plot of comparison: intervention versus standard care. Outcome: severity of PTSD symptoms at latest follow-up. The latest follow-up was: for Resnick et al. (Citation2007) 6-months post-intervention, for Rothbaum et al. (Citation2012) 12 weeks, for Miller et al. (Citation2015) 2 months and for Nixon et al. (Citation2016) 1 year. Produced using Review Manager (RevMan) [Computer program]. Version 5.3. Copenhagen: The Nordic Cochrane Centre, The Cochrane Collaboration, 2014.
![Figure 4. Forest plot of comparison: intervention versus standard care. Outcome: severity of PTSD symptoms at latest follow-up. The latest follow-up was: for Resnick et al. (Citation2007) 6-months post-intervention, for Rothbaum et al. (Citation2012) 12 weeks, for Miller et al. (Citation2015) 2 months and for Nixon et al. (Citation2016) 1 year. Produced using Review Manager (RevMan) [Computer program]. Version 5.3. Copenhagen: The Nordic Cochrane Centre, The Cochrane Collaboration, 2014.](/cms/asset/629be318-1850-4040-b986-8609792e4e36/zept_a_1682932_f0004_oc.jpg)
Table B1. Risk of bias of Echeburúa et al. (Citation1996).
Table B2. Risk of bias of Resnick et al. (Citation2007).
Table B3. Risk of bias of Rothbaum et al. (Citation2012).
Table B4. Risk of bias of Tarquinio et al. (Citation2012a).
Table B5. Risk of bias of Tarquinio et al. (Citation2012b).
Table B6. Risk of bias of Miller et al. (Citation2015).
Table B7. Risk of bias of Nixon et al. (Citation2016).