Figures & data
Figure 1. Facial trustworthy morphs. Morphs from the left to right are: trustworthy (100% trustworthy), neutral morph (50% trustworthy, 50% untrustworthy), and the untrustworthy morph (0% trustworthy) morph (Oosterhof & Todorov, Citation2009; Todorov et al., Citation2008).
Table 1. Demographic and clinical characteristics of study population (N = 70).
Table 2. Two-way multilevel mixed effect linear regression on natural logarithmic reaction time (N = 70).
Figure 2. Behavioural differences in the natural logarithmic reaction times by group and morph. HC = healthy controls, LPTS = low posttraumatic stress symptoms, and HPTS = high posttraumatic stress symptoms.
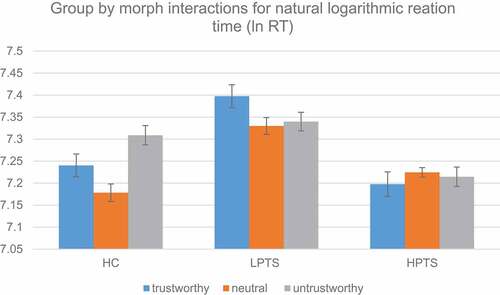
Table 3. Two-way multilevel mixed effect linear regression on ratings (N = 70).
Figure 3. Behavioural differences in trustworthy ratings by group and morph. The rating scale is: 1 = very trustworthy, 2 = somewhat trustworthy, 3 = 50/50, 4 = somewhat untrustworthy, and 5 = very untrustworthy. HC = healthy controls, LPTS = low posttraumatic stress symptoms, and HPTS = high posttraumatic stress symptoms.
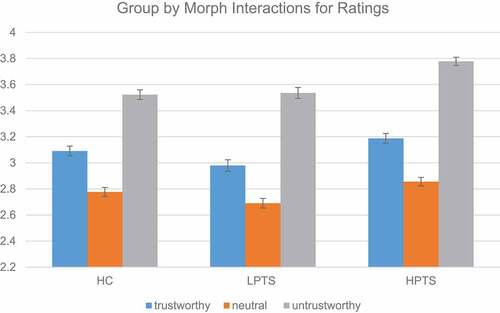
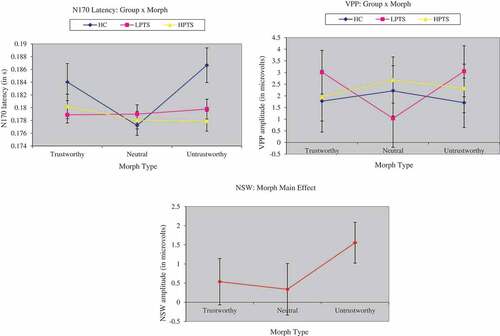
Figure 4. Event-related potentials at the N170 latency, VPP, and NSW. The first graph shows group by morph differences at the N170 latency. The second graph shows group by morph differences at the VPP, and the third graph shows group differences at the NSW. VPP = vertex positive potential, NSW = negative slow wave, HC = healthy controls, LPTS = low posttraumatic stress symptoms, and HPTS = high posttraumatic stress symptoms.