Figures & data
Table 1. Latent class analysis models and fit indices.
Figure 1. Symptom endorsement patterns for the 2-class model following latent class analysis. Symptom abbreviations: RE = re-experiencing; AV = avoidance; HY = hyperarousal; AD = affective dysregulation; NSC = negative self-concept; DIR: disturbances in interpersonal relationships.
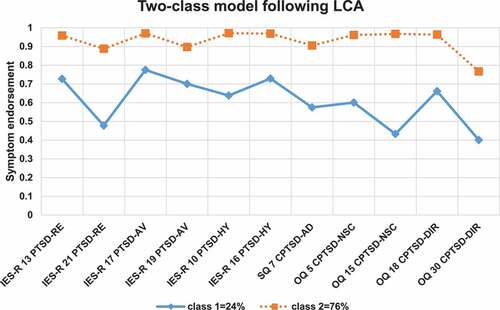
Figure 2. Symptom endorsement patterns for the 3-class model following latent class analysis. Symptom abbreviations: RE = re-experiencing; AV = avoidance; HY = hyperarousal; AD = affective dysregulation; NSC = negative self-concept; DIR: disturbances in interpersonal relationships.
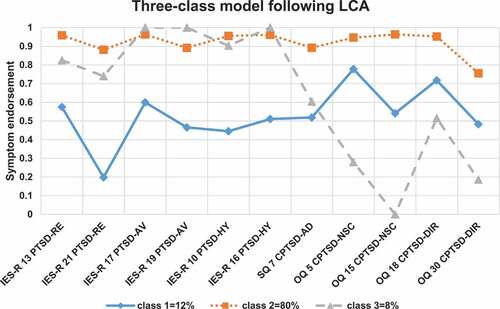
Table 2. Latent profile analysis models and fit indices.
Figure 3. Class proportions and mean scores on each item for each class, for the 4-class model (with spherical clusters of unequal size) resulting from the latent profile analysis. Symptom abbreviations: RE = re-experiencing; AV = avoidance; HY = hyperarousal; AD = affective dysregulation; NSC = negative self-concept; DIR: disturbances in interpersonal relationships.
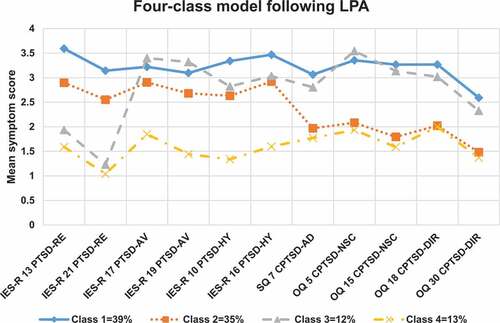
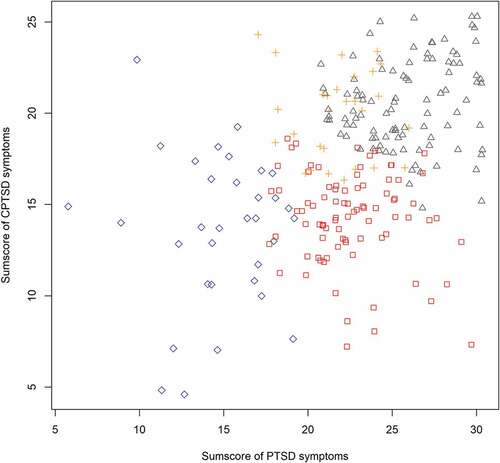
Figure 4. Jittered scatterplot with the sum of present PTSD symptoms (items scoring >1 on a 0–4 scale) versus the sum of present CPTSD-specific items (items scoring >1 on a 0–4 scale). Colour of points corresponds to class membership of the three-class model following latent class analysis; (blue) diamond = class 1 (CPTSD with low symptom endorsement), (red) square = class 2 (CPTSD), (grey) triangle = class 3 (PTSD).
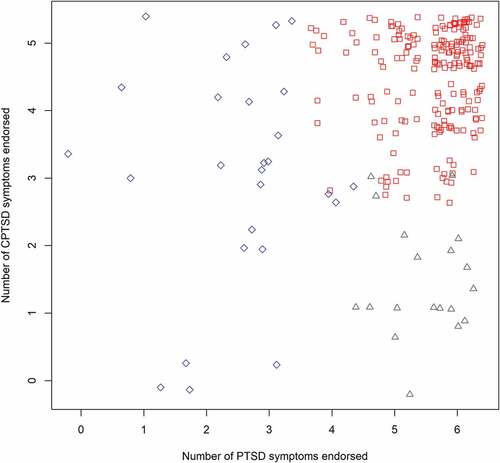
Figure 5. Jittered scatterplot with the sum of the scores on all six PTSD symptom items (scored 1–5) versus the sum of the scores on all CPTSD-specific items (scored 1–5) that were included in the latent profile analysis. Colour of points corresponds to class membership of the four-class model following latent profile analysis; (blue) diamond = class 1, (red) square = class 2, (grey) triangle = class 3 (PTSD), (orange) cross = class 4.