
Figures & data
Table 1. Sociodemographic characteristics of the study sample (sample size = 545).
Table 2. Clinical and health-related quality of life characteristics of the study sample.
Table 3. Hierarchical regression: Depression x PTSD symptomatology predicting Mental Component Score (MCS).
Figure 1. Predicted Mental Component Score (MCS), and Role Emotional (RE) according to posttraumatic stress disorder (PTSD) symptom severity, across three levels of depression symptom severity. Higher scores on PTSD and depression indicate more severe symptomatology. Higher scores on MCS and RE indicate better health-related quality of life.
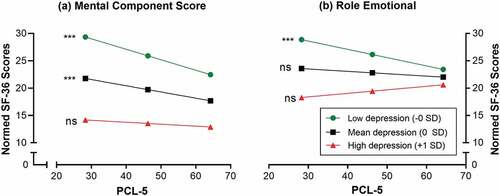
Table 4. Hierarchical regression: Depression x PTSD symptomatology predicting Physical Component Score (PCS).