
Figures & data
Figure 1. Therapeutic triad and perspectives measured
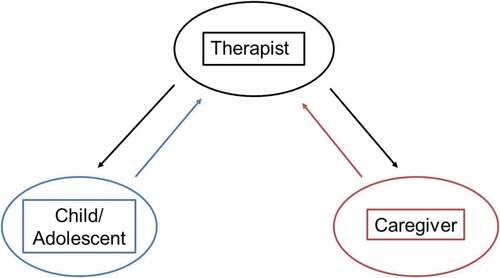
Table 1. Socio-demographic and clinical characteristics of patients (N = 76)
Table 2. Means and standard deviations of sum scores of the Working Alliance Inventory short form (WAI-S) from four perspectives at mid-treatment and post-treatment; mean differences with paired t-tests, effect sizes (Cohens d)
Table 3. Pearson correlation matrix for WAI and CAPS-CA ratings (mid- and post-treatment)
Table 4. Results of the mixed-effects regression analysis
Supplemental material
Supplemental Material
Download MS Word (14.6 KB)Data availability statement
Given that the ethical committee agrees, the datasets used and/or analyzed during the current study are available from the corresponding author on reasonable request ([email protected]).