
Figures & data
Table 1. Descriptive statistics for number of days since baseline, PCL-IV, and SF-12 PCS.
Table 2. Fixed effect estimates of the multilevel physical functioning change score analysis.
Figure 1. Predicted trajectory of clients’ physical functioning over the course of CPT. Clients who entered the treatment with low levels of physical functioning reported a significant improvement in their perceived physical functioning. SF-12 PCS = Short Form Physical Health Survey Physical Component Summary, SD = standard deviation, CPT = cognitive processing therapy.
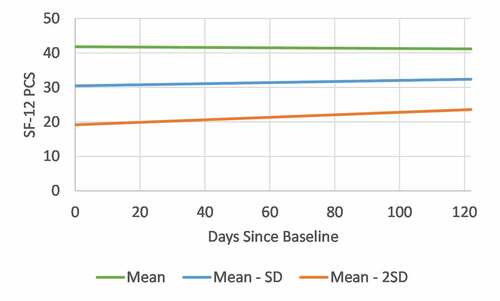
Table 3. Fixed effect estimates of the multilevel moderator analysis on the interaction between clients’ baseline physical health and PTSD symptom trajectory.
Table 4. Fixed-effect estimates for the hypothesized and exploratory multilevel lagged analyses.