Figures & data
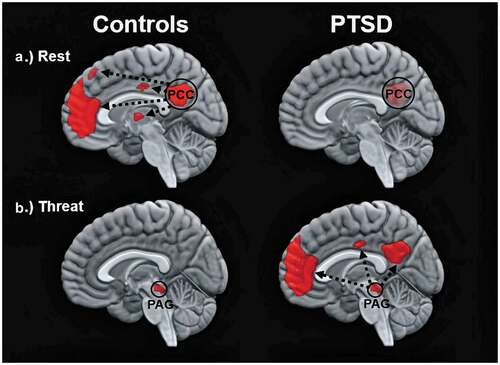
Figure 1. Images show the functional connectivity of the DMN in healthy controls (left) and in participants with PTSD (right) under different conditions. Top and bottom images depict within-group patterns in functional connectivity during rest and during trauma-related stimulus processing, respectively. Whereas resting-state functional connectivity is depicted in relation to the time series of the posterior cingulate cortex (PCC), trauma-related functional connectivity is depicted in relation to the time series of the periaqueductal grey (PAG). is an adaptation from two previous findings, where resting-state and threat-related functional connectivity are related to results by Bluhm et al. (Citation2009) and Terpou et al. (Citation2019a), respectively