
Figures & data
Table 1. Descriptive statistics of sociodemographic variables
Table 2. Descriptive statistics of the CTQ subscales, PTSD/CPTSD and functional impairment sum score for the sample (N = 147)
Table 3. Model fit indices of latent classes of childhood trauma subtypes (N = 147)
Figure 1. Graphic representation of the distinct classes
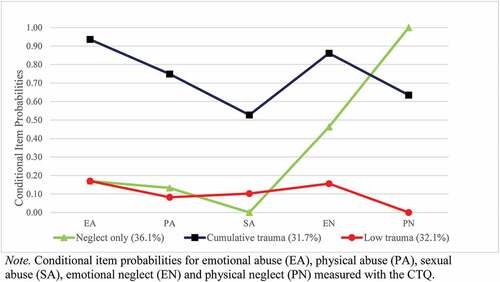
Table 4. Descriptive comparison of trauma classes according to age, PTSD, DSO and CPTSD symptom severity and functional impairment (FI) for the distinct symptom clusters PTSD and DSO
Table 5. χ2 differences for PTSD, DSO, CPTSD and functional impairment (FI) for both clusters depending on trauma classes
Table 6. Descriptive comparison of maltreatment classes according to mean and standard deviation for the CTQ subscales
Supplemental Material
Download MS Word (41.3 KB)Data availability statement
The present data were assessed in the course of a research project commissioned and funded by the government of Lower Austria. Therefore, data cannot be shared due to legal reasons.