
Figures & data
Table 1. Demographic characteristics divided by allocated group (n = 97) and comparisons between groups
Figure 1. Participant flow
EMDR, eye movement desensitization and reprocessing therapy; SUD, subjective unit of disturbance
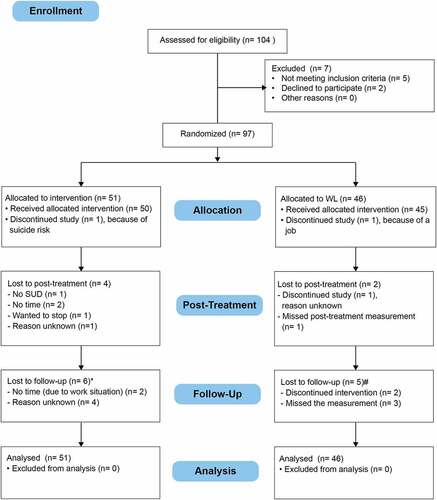
Table 2. Scores (mean (SD)) at baseline, post-treatment and 3 months follow, group by time interaction and between-group effect sizes
Table 3. Parameter estimates of the fixed effects of the LMM analysis
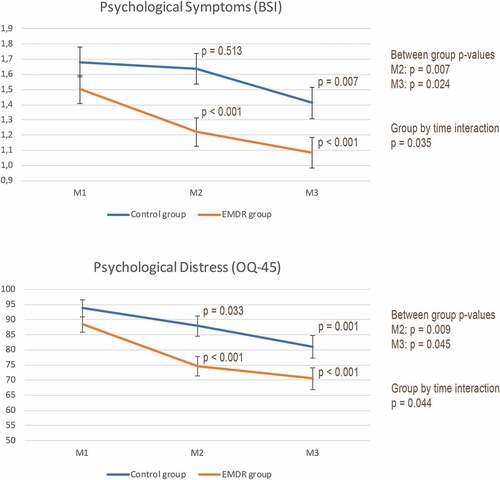
Figure 2. Differences between the groups on psychological symptoms and psychological distress over time measured with the BSI and OQ-45
*M1 = baseline measurement; M2 = post-treatment measurement; M3 = 3-month follow-up measurement; BSI = Brief Symptom Inventory; OQ-45 = Outcome Questionnaire-45
Data availability statement
Due to the nature of this research, participants of this study did not agree for their data to be shared publicly, so supporting data are not available.