
Figures & data
Table 1. Sample demographics
Figure 1. Percentage GPS item endorsement by gender and sample
F = Female, M = Male, GC-TS = Global Collaboration on Traumatic Stress. *Difference between F vs. M is statistically significant at p < .01 (2-tailed). For full statistical reporting please see the supplemental materials.
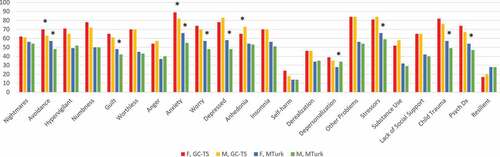
Table 2. Factor (pattern) loadings for the GPS
Table 3. Comparison of females and males on GPS scale scores across two samples
Table 4. Correlations between the GPS and correlates
Supplemental material
Supplemental Material
Download ()Data Availability Statement
The data that support the findings of this study are available from the corresponding author, PF, upon reasonable request.