
Figures & data
Figure 1. Study design
Figure 2. Flow diagram illustrating participant recruitment and retention
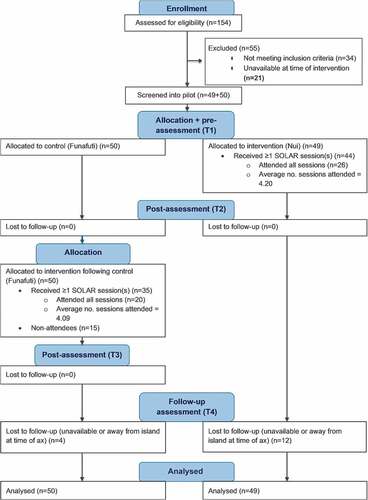
Table 1. Sample demographic data
Table 2. Results of Johnson–Neyman procedure
Table 3. Group comparisons for scores falling with the SROS regions of the Johnson–Neyman procedure
Table 4. Mean aggregate scores at each assessment point and paired sample t-tests comparing changes over time by sample
Supplemental material
Supplemental Material
Download ()Data availability statement
Participants of this study did not agree for their data to be shared publicly, so supporting data is not available.