
Figures & data
Figure 1. PRISMA flow diagram outlining the process of screening studies for inclusion in the review. PTSD, post-traumatic stress disorder.
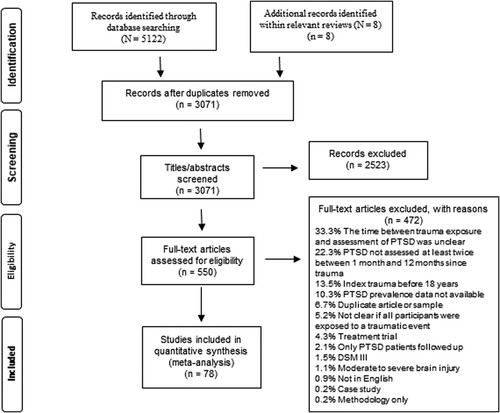
Table 1. Results from the meta-analyses conducted at each time-point after trauma exposure, showing pooled prevalence of post-traumatic stress disorder (PTSD) up to 24 months.
Table 2. Results from the meta-analyses of the changes in absolute post-traumatic stress disorder (PTSD) prevalence between time-points, as measured by risk difference.
Table 3. Results from the meta-analyses conducted at each time-point after trauma exposure comparing post-traumatic stress disorder (PTSD) prevalence following either intentional or unintentional trauma exposure.
Table 4. Results from the meta-analyses conducted at each time-point after trauma exposure comparing post-traumatic stress disorder (PTSD) prevalence following self-report measures and diagnostic interviews.
Table 5. Meta-regression of point prevalence.