
Figures & data
Table 1. Demographic and psychometric characteristics.
Figure 1. Data distribution of all groups on distance 1 (D1). Note. Black bars within box plots display medians. Rhombi within box plots represent means. Error bars represent the 95% confidence intervals. The shapes of the violins display the frequencies of the values. * p < .05. ** p < .01. Results for D2 were identical except for the EA− group (who did not differ significantly from controls on D2). CM = child maltreatment; EA = emotional abuse; EN = emotional neglect; PA = physical abuse; PN = physical neglect; SA = sexual abuse; − = without depressive symptoms; + = with depressive symptoms.
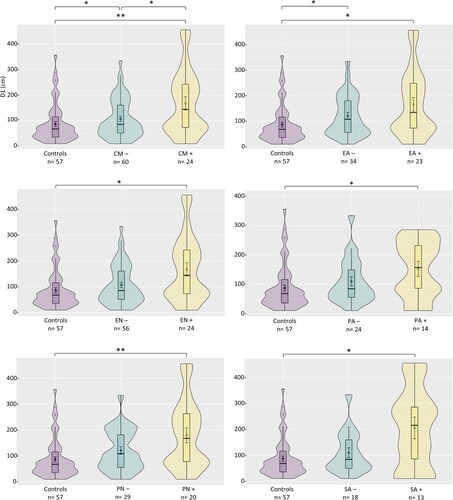
Table 2. Group comparisons on D1 and D2.
Supplemental Material
Download MS Word (28.1 KB)Data availability statement
The data that support the findings of this study are available on request from the corresponding author, [MCP]. The data are not publicly available due to information that could compromise the privacy of research participants.