Figures & data
Table 1. Sources of mast data.
Figure 1. The panels show (1) vole abundance, (2) monthly averaged human PUUV cases, (3) the abundance of PUUV positive voles, (4) the mast score, (5) the mast score of the previous year, and (6) monthly maximum temperature, the Netherlands 2006–2016.
Figure 2. (a) Mast score by year for the Netherlands, 2007–2015. The green line gives the mast score for oak, the red line the score for beech. The blue line is the sum, which we use in the model. (b) Vole abundance in Twente, the Netherlands, for June and October 2008–2014. (c) The total number of human PUUV cases per year, the Netherlands 2009–2015.
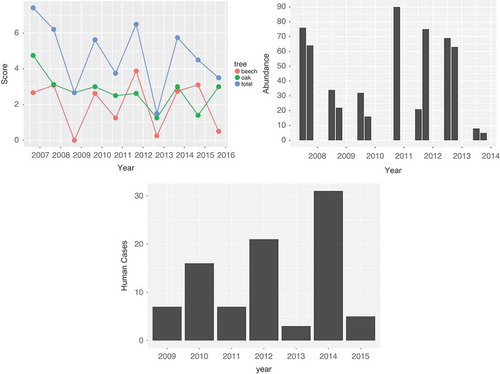
Figure 3. Prediction of vole abundance from mast score. The measured mast score is indicated by the bars, the prediction and 95% confidence interval by the blue line and grey band.
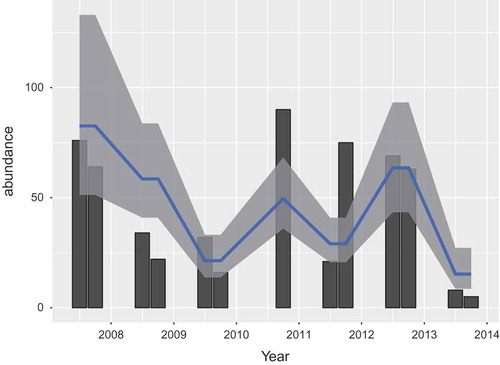
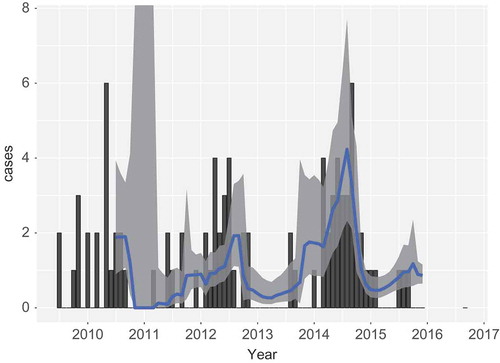
Figure 4. Human cases (bars) and model prediction of the monthly rate of infection with 95% prediction intervals. Panels (a)and (b) are based on mast data, including and excluding monthly temperature, respectively. Panels (c) and (d) are based on based on infected vole abundance, including and excluding monthly temperature, respectively.
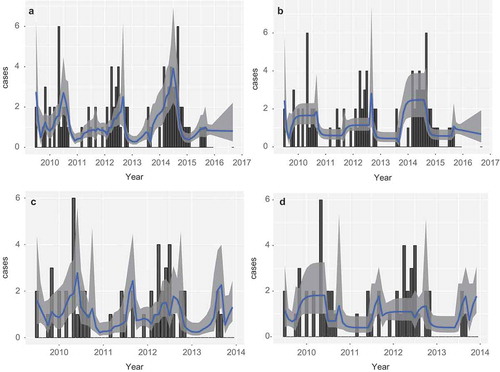
Figure 5. Residuals between model prediction and actual human cases, aggregated by year. Coloured bars indicate the different models. Models depending on vole abundance can only predict up to year 2013 due to data unavailability.
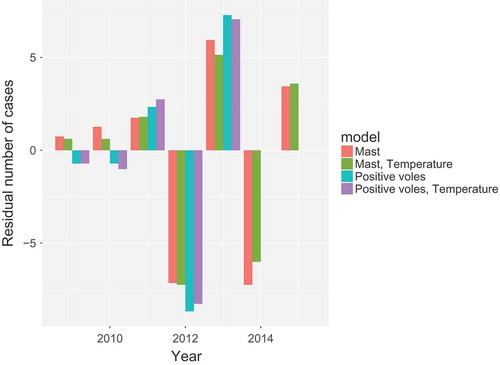
Figure 6. Human cases (bars) and model prediction of the monthly rate of infection with 95% prediction intervals, based on mast data. Only data from before the point of prediction is included in the model. The model takes monthly temperature into account.