
Figures & data
Figure 1. Geographical map of sampling area. Striped green areas indicate visited districts (1 = Ngorongoro, 2 = Mvomero, 3 = Kilombero, 4 = Ulanga). Striped red areas indicate parks or game reserves, i.e. areas with a higher concentration of wildlife (A = Ngorongoro Conservation Area, including Ngorongoro National Park, B = Mikumi National Park, C = Selous Game Reserve).
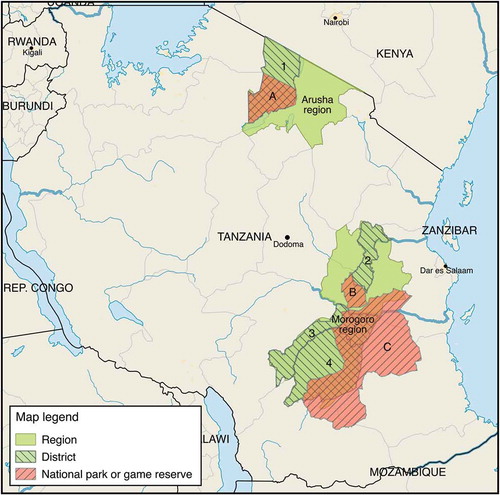
Table 1. Seroprevalence at individual animal level according to sex, species, age group, and vaccination status (PPR) from the first round of a repeated cross-sectional study of small ruminants carried out in Tanzania in 2014.
Table 2. Seroprevalence at individual animal level according to sex, species, age group, and vaccination status (PPR and CCPP) from the second round of a repeated cross-sectional study of small ruminants carried out in Tanzania in 2015.
Table 3. Univariable and multivariable analyses for risk factors associated with PPR seropositivity at individual animal level and herd level.
Table 4. Univariable and multivariable analyses for risk factors associated with CCPP seropositivity at individual animal level and herd level.
Table 5. Univariable and multivariable analysis for risk factors associated with FMD seropositivity at individual animal level and herd level.
Table 6. Univariable and multivariable analyses for risk factors associated with BT seropositivity at individual animal level and herd level.
Table 7. Univariable analysis for risk factor associated with BVD seropositivity at individual animal level.