Figures & data
Table 1. List of primers used in this study for sequencing of HCV NS5B region by the population sequencing method.
Table 2. RASs in HCV NS5B patient samples identified by the population sequencing method.
Figure 1. Comparison of the binding pose of compound 28V and dasabuvir. (A) The close-up view of the binding pose of 28V (purple) co-crystallized with HCV NS5B polymerase (PDB ID: 4MKB). (B) The close-up view of the binding poses of dasabuvir with HCV NS5B polymerase generated using AutoDock Vina (cyan) and iGEMCDOCK (orange). (C) The superimposed binding poses of compound 28V and dasabuvir.
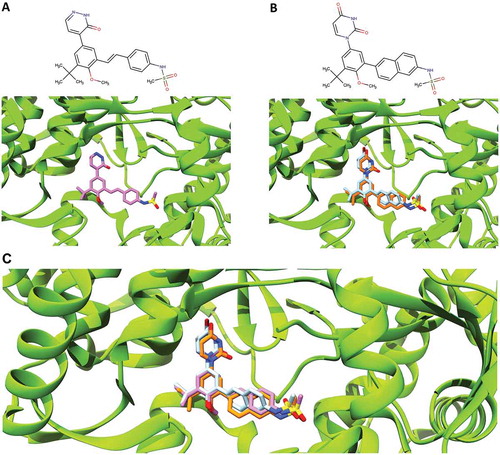
Figure 2. NS5B backbone root-mean-square deviation (RMSD) and radius of gyration (Rg) plotted with respect to time. The RMSD fluctuation of NS5B in complex with dasabuvir and of the free NS5B are shown in pictures (A,B), respectively. Similarly, the radius of gyration (Rg) of NS5B in complex with dasabuvir and the free NS5B are shown in pictures (C,D), respectively. In picture E, the RMSD fluctuation of dasabuvir over time is shown. The different simulation replicate is color coded as follows: the first simulation is shown in black, second simulation is shown in green, third simulation in red and fourth simulation in blue.
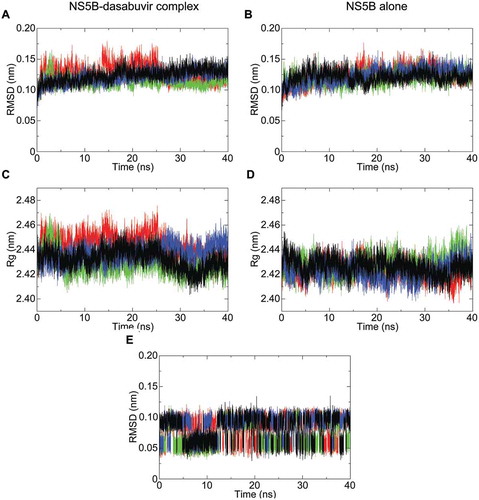
Figure 3. Dasabuvir’s binding pose with HCV NS5B polymerase generated using MD simulations. Dasabuvir is shown in orange, while HCV NS5B polymerase is shown in green. Clinically relevant HCV NS5B RASs and residues forming hydrogen bonds with dasabuvir are displayed with residue indexes. Hydrogen bonds are shown as yellow lines.
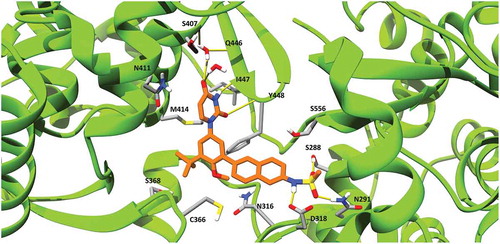
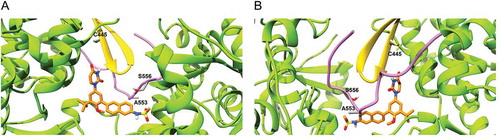
Figure 4. Location of residues 445, 553 and 556 in the dasabuvir binding site. (a) Front view and (b) Back view. In the picture, the β-hairpin loop is colored in yellow and the C-terminal tail in purple. As it can be seen, both the β-hairpin loop and C-terminal domain form a predominant part of the dasabuvir (colored in orange) binding site.