
Figures & data
Figure 1. Map of Kenya and the two study areas, Tana River and Garissa Counties, with towns involved in the study highlighted.
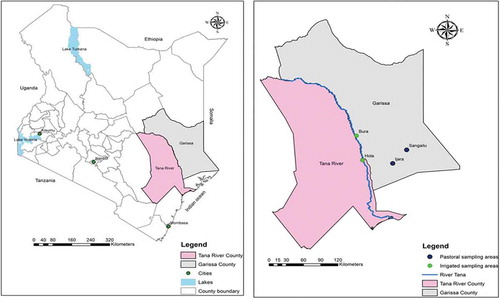
Figure 2. The phylogenetic analysis was performed on isolates from both study counties (highlighted with black dots) and compared with sequences of the secY gene of known leptospiral species. The evolutionary history was infered using the Maximum Likelihood method based on the Tamura-Nei model [Citation26]. The tree with the highest log likelihood (−1108.1041) is shown. The percentage of trees in which the associated taxa clustered together is shown next to the branches.
![Figure 2. The phylogenetic analysis was performed on isolates from both study counties (highlighted with black dots) and compared with sequences of the secY gene of known leptospiral species. The evolutionary history was infered using the Maximum Likelihood method based on the Tamura-Nei model [Citation26]. The tree with the highest log likelihood (−1108.1041) is shown. The percentage of trees in which the associated taxa clustered together is shown next to the branches.](/cms/asset/b429176a-8795-4af5-a837-e12753c650c0/ziee_a_1547093_f0002_b.gif)
Table 1. Distribution of rodents collected with the towns and diagnostic test results in the study sites.
Table 2. Summary findings of focus group discussion of the perceptions of human diseases and wildlife in the community.
Table 3. Rodent samples from Garissa and Tana river county tested for Leptospira spp. using both ELISA and PCR.