Figures & data
Figure 1. Photomicrographs of HE-stained sections. Bar = 50 µm (a, b, c) or 100 µm (d, e, f). Short arrows = perineural or perivascular lymphoplasmacytic infiltrates, long arrows = lymphoplasmacytic cells, * = diffuse intramuscular infiltrates. Lymphoplasmacytic neutritis, perineuritis and myositis in crop (a), proventriculus (b) and gizzard (c). Lymphoplasmacytic myositis in crop (d), proventriculus (e) and gizzard (f).
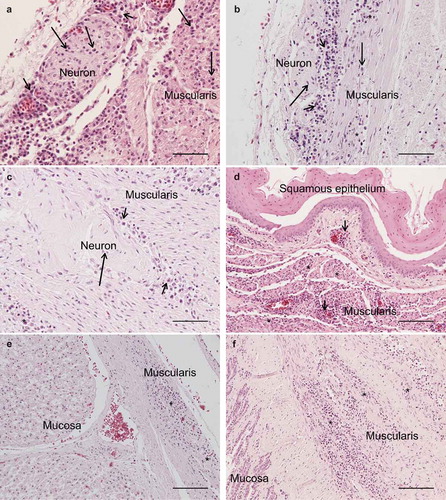
Figure 2. Photomicrographs of HE-stained sections, bar = 100 µm. Perivascular lymphoplasmacytic infiltrates and diffuse gliosis in the white matter of the cerebellum (A) and cerebrum (B).
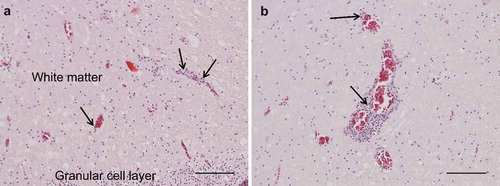
Figure 3. Photomicrographs of IHC to identify T and B cells, bar = 100 µm. Arrows = perivascular lymphoplasmacytic infiltrates. Cerebrum, negative control (a). Cerebrum, CD3-staining, numerous strongly positive (brown) cells (b). Cerebrum, CD79-staining, no positive cells (c).
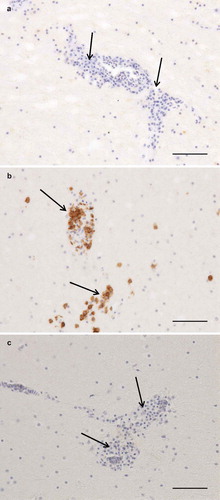
Table 1. Identity between PaBV-4 reported and members of Genus Orthobornavirus.
Figure 4. Phylogenetic relationships between the genotype identified in the present study and the selected genotypes from each Bornavirus species, regarding the N, X, P and M genes sequences. The evolutionary history was inferred using the Neighbor-Joining method. The percentage of replicate trees in which the associated taxa clustered together in the bootstrap test (1000 replicates) are shown next to the branches. The tree is drawn to scale, with branch lengths in the same units as those of the evolutionary distances used to infer the phylogenetic tree. The evolutionary distances were computed using the Maximum Composite Likelihood method and are in the units of the number of base substitutions per site. The analysis involved 30 nucleotide sequences. There were a total of 1527 positions in the final dataset. Evolutionary analyses were conducted in MEGA7. Sequences identified by GenBank® accession numbers, name of virus and its abbreviation name. The sequence marked with a circle was produced during this study.
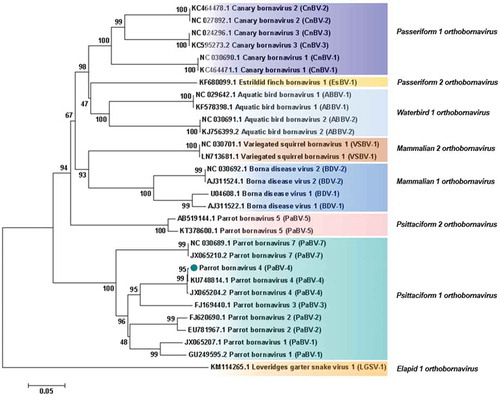
Figure 5. Phylogenetic relationships between the genotype identified in the present study and the selected genotypes from each Bornavirus species, regarding the complete P protein sequences. The evolutionary history was inferred using the Neighbor-Joining method. The percentage of replicate trees in which the associated taxa clustered together in the bootstrap test (1000 replicates) are shown next to the branches. The tree is drawn to scale, with branch lengths in the same units as those of the evolutionary distances used to infer the phylogenetic tree. The evolutionary distances were computed using the Poisson correction method and are in the units of the number of amino acid substitutions per site. The analysis involved 31 amino acid sequences. All positions containing gaps and missing data were eliminated. There were a total of 192 positions in the final dataset. Evolutionary analyses were conducted in MEGA7. Sequences identified by GenBank® accession numbers, name of virus and its abbreviation name. The sequence marked with a circle was produced during this study.
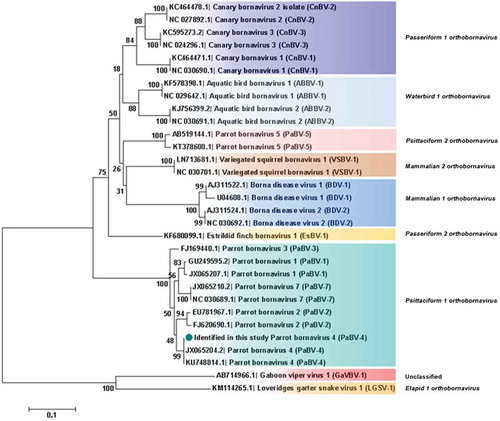
Table 2. Identity between parrot bornavirus 4 (PaBV-4) worldwide distributed.
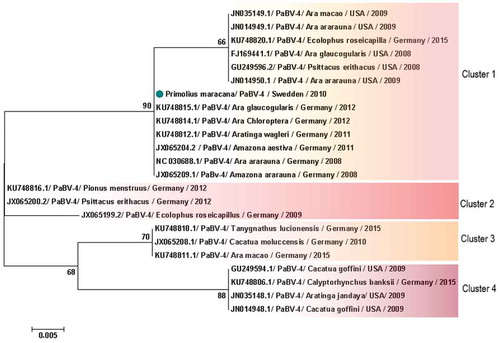
Figure 6. Clusters of PaBV-4 N nucleotide sequences identified from Psittaciforms. The evolutionary history was inferred using the Neighbor-Joining method. The percentage of replicate trees in which the associated taxa clustered together in the bootstrap test (1000 replicates) are shown next to the branches. The tree is drawn to scale, with branch lengths in the same units as those of the evolutionary distances used to infer the phylogenetic tree. The evolutionary distances were computed using the Maximum Composite Likelihood method and are in the units of the number of base substitutions per site. All positions containing gaps and missing data were eliminated. There were a total of 305 positions in the final dataset. Evolutionary analyses were conducted in MEGA7. PaBV-4 sequences are identified with GenBank® accession numbers, with the name of the host in Latin, country origin and time of sampling. The sequence marked with a circle was produced during this study.
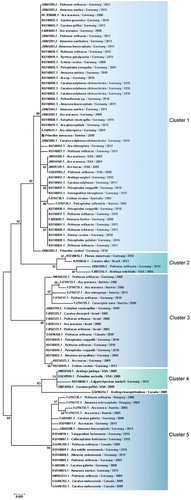
Figure 7. Clusters of PaBV-4 X protein sequences identified from Psittaciforms. The evolutionary history was inferred using the Neighbor-Joining method. The percentage of replicate trees in which the associated taxa clustered together in the bootstrap test (1000 replicates) are shown next to the branches. The tree is drawn to scale, with branch lengths in the same units as those of the evolutionary distances used to infer the phylogenetic tree. The evolutionary distances were computed using the Poisson correction method and are in the units of the number of amino acid substitutions per site. The analysis involved 23 amino acid sequences. All positions containing gaps and missing data were eliminated. There were a total of 85 positions in the final dataset. Evolutionary analyses were conducted in MEGA7. PaBV-4 sequences are identified with GenBank® accession numbers, with the name of the host in Latin, country origin and time of sampling. Sequences identified by GenBank® accession numbers, name of virus and its abbreviation name. The sequence marked with a circle was produced during this study.