
Figures & data
Figure 1. Borna disease virus 1 (BoDV-1) genomic map and protein-coding mRNA transcripts. BoDV uses alternative transcription strategies, like over-lapping open reading frames (ORFs) and usage of host cellular splicing mechanisms. Abbreviations: S1–S3 initiation sites of transcription; T1–T4 termination sites of transcription; (N) nucleoprotein gene; (X) X protein gene; (P) phosphoprotein gene; (M) matrix protein gene; (G) glycoprotein gene; (L) RNA-dependent RNA-polymerase gene [Citation1]. The genomic map is similar for all bornaviruses, as far as known, except for Queensland carbovirus and the Southwest carbovirus, which have the gene order 3ʹ-N-X-P-G-M-L-5ʹ, representing a transposition of the G and M genes [Citation19].
![Figure 1. Borna disease virus 1 (BoDV-1) genomic map and protein-coding mRNA transcripts. BoDV uses alternative transcription strategies, like over-lapping open reading frames (ORFs) and usage of host cellular splicing mechanisms. Abbreviations: S1–S3 initiation sites of transcription; T1–T4 termination sites of transcription; (N) nucleoprotein gene; (X) X protein gene; (P) phosphoprotein gene; (M) matrix protein gene; (G) glycoprotein gene; (L) RNA-dependent RNA-polymerase gene [Citation1]. The genomic map is similar for all bornaviruses, as far as known, except for Queensland carbovirus and the Southwest carbovirus, which have the gene order 3ʹ-N-X-P-G-M-L-5ʹ, representing a transposition of the G and M genes [Citation19].](/cms/asset/adcc439d-4dad-46ef-b6c9-9854b742a9b0/ziee_a_1685632_f0001_oc.jpg)
Figure 2. Phylogeny shows the species and strains belonging to the Bornaviridae family, which were associated with the development of neurological and/or gastrointestinal disease and/or death of its hosts. The phylogenetic relationship between species and strains was based on a segment of the M gene. Sequences identified by GenBank® accession numbers and abbreviated name of virus. Bornaviruses marked with asterisks are not classified following the currently accepted taxonomy [Citation4]. ABBV-1 to 2 = aquatic bird bornavirus 1 to 2, BoDV-1 to 2 = Borna disease virus 1 to 2, CnBV-1 to 3 = canary bornavirus 1 to 3, EsBV-1 = estrildid finch bornavirus 1, JCPV = jungle carpet python virus. LGSV-1 = Loveridge’s garter snake virus 1, SWCPV = southwest carpet python virus, PaBV-1 to 8 = parrot bornavirus 1 to 8, VSBV-1 = variegated squirrel bornavirus 1.
![Figure 2. Phylogeny shows the species and strains belonging to the Bornaviridae family, which were associated with the development of neurological and/or gastrointestinal disease and/or death of its hosts. The phylogenetic relationship between species and strains was based on a segment of the M gene. Sequences identified by GenBank® accession numbers and abbreviated name of virus. Bornaviruses marked with asterisks are not classified following the currently accepted taxonomy [Citation4]. ABBV-1 to 2 = aquatic bird bornavirus 1 to 2, BoDV-1 to 2 = Borna disease virus 1 to 2, CnBV-1 to 3 = canary bornavirus 1 to 3, EsBV-1 = estrildid finch bornavirus 1, JCPV = jungle carpet python virus. LGSV-1 = Loveridge’s garter snake virus 1, SWCPV = southwest carpet python virus, PaBV-1 to 8 = parrot bornavirus 1 to 8, VSBV-1 = variegated squirrel bornavirus 1.](/cms/asset/e40fedf8-ee5b-4e44-88fb-b82a9d293dd3/ziee_a_1685632_f0002_oc.jpg)
Figure 3. X-ray performed on the parrot case number B261018, using barium contrast. (a) Dorsal-ventral view and (b) side-to-side view after the introduction of barium contrast in the crop (marked with the blue arrow). (c) Dorsal-ventral view and (d) side-to-side view of the diffusion start of barium contrast in the proventriculus. (e) Dorsal-ventral view and (f) lateral-lateral view allowing the visualization of the diffusion of barium contrast throughout the proventriculus, highlighting its delineation, which revealed a severe dilatation (marked with the blue arrow).
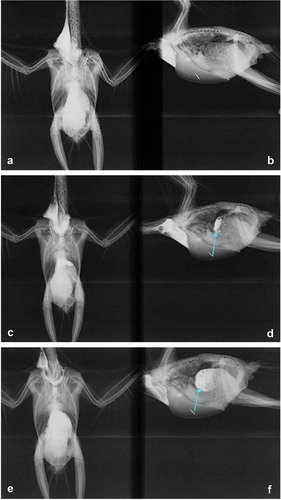
Figure 4. The proventriculus of parrot case number B261018, at necropsy. The severe dilatation (asterisk) produced a small rupture in the proventriculus wall (arrow).
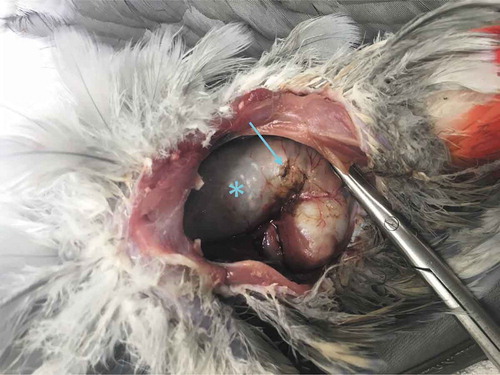
Table 1. The per cent identity between the PaBV-4 genotypes detected in Portugal and bornaviruses worldwide distributed, regarding X and P protein.
Figure 5. Phylogenetic relationships between PaBV-4 genotypes identified in the present study and PaBV-4 detected in wild birds as in pet parrots, regarding N gene. The evolutionary history was inferred using the Neighbor-Joining method [Citation21]. The confidence probability was estimated using the bootstrap test (1000 replicates) and is shown above the branches [Citation22,Citation23]. The tree is drawn to scale, with branch lengths in the same units as those of the evolutionary distances used to infer the phylogenetic tree. The evolutionary distances were computed using the Kimura two-parameter method [Citation24] and are in the units of the number of base substitutions per site. The analysis involved 60 nucleotide sequences. All positions containing gaps and missing data were eliminated. There was a total of 163 positions in the final dataset. Evolutionary analyses were conducted in MEGA7 [Citation20]. Sequences identified by GenBank® accession numbers, abbreviation name of virus and its hosts, year and geographic origin of sampling. PaBV-4 = parrot bornavirus 4. The sequences marked with a circle were produced during this study and triangles marked nucleotide sequences identified from wild birds.
![Figure 5. Phylogenetic relationships between PaBV-4 genotypes identified in the present study and PaBV-4 detected in wild birds as in pet parrots, regarding N gene. The evolutionary history was inferred using the Neighbor-Joining method [Citation21]. The confidence probability was estimated using the bootstrap test (1000 replicates) and is shown above the branches [Citation22,Citation23]. The tree is drawn to scale, with branch lengths in the same units as those of the evolutionary distances used to infer the phylogenetic tree. The evolutionary distances were computed using the Kimura two-parameter method [Citation24] and are in the units of the number of base substitutions per site. The analysis involved 60 nucleotide sequences. All positions containing gaps and missing data were eliminated. There was a total of 163 positions in the final dataset. Evolutionary analyses were conducted in MEGA7 [Citation20]. Sequences identified by GenBank® accession numbers, abbreviation name of virus and its hosts, year and geographic origin of sampling. PaBV-4 = parrot bornavirus 4. The sequences marked with a circle were produced during this study and triangles marked nucleotide sequences identified from wild birds.](/cms/asset/13db681d-6892-4fbb-a64d-5ac96d9969f6/ziee_a_1685632_f0005_oc.jpg)
Figure 6. Phylogenetic relationships between PaBV-4 genotypes identified in the present study and bornaviruses detected in mammalian and in wild birds, based on N gene (a) and on N protein (b). The evolutionary history was inferred using the Neighbor-Joining method [Citation21]. The confidence probability (multiplied by 100) was estimated using the bootstrap test (1000 replicates) and is shown next to the branches [Citation22,Citation23]. Both trees were drawn to scale, with branch lengths in the same units as those of the evolutionary distances used to infer the phylogenetic tree. Both trees were rooted with a vaccine strain (accession nº DQ680832.1). Evolutionary analyses were conducted in MEGA7 [Citation20]. (a) The evolutionary distances were computed using the Kimura two-parameter method [Citation24] and are in the units of the number of base substitutions per site. The analysis involved 23 nucleotide sequences. All positions containing gaps and missing data were eliminated. There were a total of 215 positions in the final dataset. (b) The evolutionary distances were computed using the Poisson correction method [Citation25] and are in the units of the number of amino acid substitutions per site. The analysis involved 23 amino acid sequences. All positions containing gaps and missing data were eliminated. There were a total of 71 positions in the final dataset. Sequences identified by GenBank® accession numbers, abbreviation name of virus and its hosts, year and geographic origin of sampling. ABBV-1 = aquatic bird bornavirus 1, ABBV-2 = aquatic bird bornavirus 2, BoDV-1 = Borna disease virus 1, PaBV-4 = parrot bornavirus 4, VSBV-1 = variegated squirrel bornavirus 1. The sequences marked with a circle were produced during this study and triangles marked nucleotide sequences identified from samples of wild birds.
![Figure 6. Phylogenetic relationships between PaBV-4 genotypes identified in the present study and bornaviruses detected in mammalian and in wild birds, based on N gene (a) and on N protein (b). The evolutionary history was inferred using the Neighbor-Joining method [Citation21]. The confidence probability (multiplied by 100) was estimated using the bootstrap test (1000 replicates) and is shown next to the branches [Citation22,Citation23]. Both trees were drawn to scale, with branch lengths in the same units as those of the evolutionary distances used to infer the phylogenetic tree. Both trees were rooted with a vaccine strain (accession nº DQ680832.1). Evolutionary analyses were conducted in MEGA7 [Citation20]. (a) The evolutionary distances were computed using the Kimura two-parameter method [Citation24] and are in the units of the number of base substitutions per site. The analysis involved 23 nucleotide sequences. All positions containing gaps and missing data were eliminated. There were a total of 215 positions in the final dataset. (b) The evolutionary distances were computed using the Poisson correction method [Citation25] and are in the units of the number of amino acid substitutions per site. The analysis involved 23 amino acid sequences. All positions containing gaps and missing data were eliminated. There were a total of 71 positions in the final dataset. Sequences identified by GenBank® accession numbers, abbreviation name of virus and its hosts, year and geographic origin of sampling. ABBV-1 = aquatic bird bornavirus 1, ABBV-2 = aquatic bird bornavirus 2, BoDV-1 = Borna disease virus 1, PaBV-4 = parrot bornavirus 4, VSBV-1 = variegated squirrel bornavirus 1. The sequences marked with a circle were produced during this study and triangles marked nucleotide sequences identified from samples of wild birds.](/cms/asset/5130f61d-9587-4392-9e4d-306f1a40b843/ziee_a_1685632_f0006_oc.jpg)
Figure 7. Phylogenetic relationships between PaBV-4 genotypes identified in the present study and bornaviruses detected in mammalian and wild birds, based on P gene (a) and on P protein (b). The evolutionary history was inferred using the Neighbor-Joining method [Citation21]. The confidence probability (multiplied by 100) was estimated using the bootstrap test (1000 replicates) and is shown next to the branches [Citation22,Citation23]. Both trees were drawn to scale, with branch lengths in the same units as those of the evolutionary distances used to infer the phylogenetic tree. Both trees were rooted with a vaccine strain (accession nº DQ680832.1). Evolutionary analyses were conducted in MEGA7 [Citation20]. (a) The evolutionary distances were computed using the Kimura two-parameter method [Citation24] and are in the units of the number of base substitutions per site. The analysis involved 20 nucleotide sequences. All positions containing gaps and missing data were eliminated. There were a total of 386 positions in the final dataset (b). The evolutionary distances were computed using the Poisson correction method [Citation25] and are in the units of the number of amino acid substitutions per site. The analysis involved 20 amino acid sequences. All positions containing gaps and missing data were eliminated. There were a total of 110 positions in the final dataset. Sequences identified by GenBank® accession numbers, abbreviation name of virus and its hosts, year and geographic origin of sampling. ABBV-1 = aquatic bird bornavirus 1, ABBV-2 = aquatic bird bornavirus 2, BoDV-1 = Borna disease virus 1, PaBV-4 = parrot bornavirus 4, VSBV-1 = variegated squirrel bornavirus 1. The sequences marked with a circle were produced during this study and triangles marked nucleotide sequences identified from samples of wild birds.
![Figure 7. Phylogenetic relationships between PaBV-4 genotypes identified in the present study and bornaviruses detected in mammalian and wild birds, based on P gene (a) and on P protein (b). The evolutionary history was inferred using the Neighbor-Joining method [Citation21]. The confidence probability (multiplied by 100) was estimated using the bootstrap test (1000 replicates) and is shown next to the branches [Citation22,Citation23]. Both trees were drawn to scale, with branch lengths in the same units as those of the evolutionary distances used to infer the phylogenetic tree. Both trees were rooted with a vaccine strain (accession nº DQ680832.1). Evolutionary analyses were conducted in MEGA7 [Citation20]. (a) The evolutionary distances were computed using the Kimura two-parameter method [Citation24] and are in the units of the number of base substitutions per site. The analysis involved 20 nucleotide sequences. All positions containing gaps and missing data were eliminated. There were a total of 386 positions in the final dataset (b). The evolutionary distances were computed using the Poisson correction method [Citation25] and are in the units of the number of amino acid substitutions per site. The analysis involved 20 amino acid sequences. All positions containing gaps and missing data were eliminated. There were a total of 110 positions in the final dataset. Sequences identified by GenBank® accession numbers, abbreviation name of virus and its hosts, year and geographic origin of sampling. ABBV-1 = aquatic bird bornavirus 1, ABBV-2 = aquatic bird bornavirus 2, BoDV-1 = Borna disease virus 1, PaBV-4 = parrot bornavirus 4, VSBV-1 = variegated squirrel bornavirus 1. The sequences marked with a circle were produced during this study and triangles marked nucleotide sequences identified from samples of wild birds.](/cms/asset/bb3b9e2e-9bf0-4fb1-8d39-09a5d8e30768/ziee_a_1685632_f0007_oc.jpg)